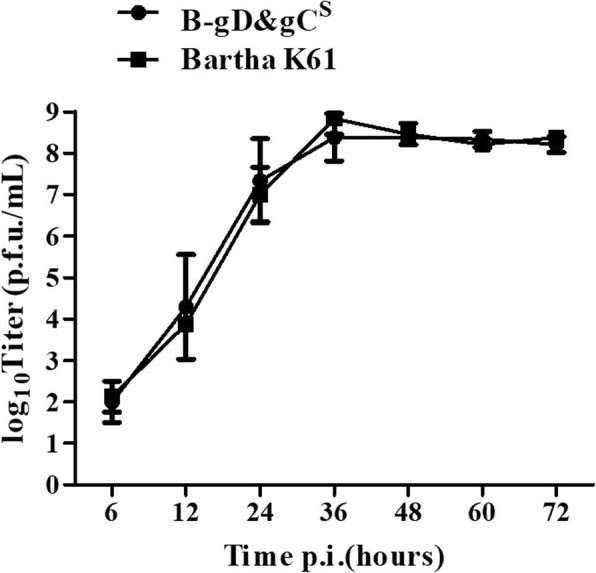
Fig. 3.

Multi-step growth curves of Bartha-K61 and PRV B-gD&gCS on STs. At 0, 6, 12, 24, 36, 48, 60 and 72 h post infection, virus was titrated on STs with a MOI of 0.01. Data were presented as mean ± SD, and analyzed using Student’s t test by SPSS 16.0 (SPSS Inc., Chicago, IL, USA)
