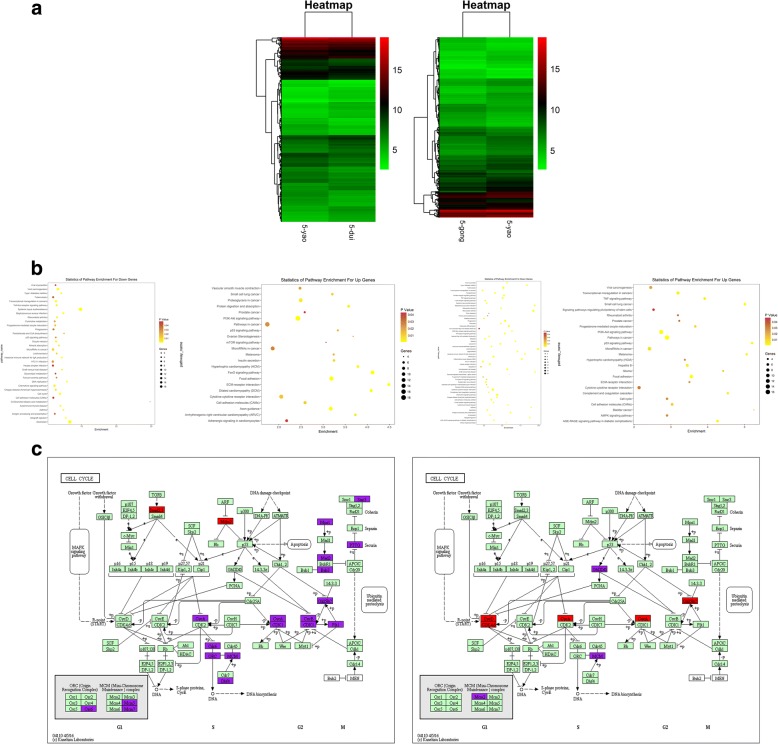
Fig. 4.
The effect of MB-MSCs on epirubicin-induced gene expressions of GCs. a The hierarchical cluster analysis of the mRNA level of GCs in different groups. b Enrichment analysis of differentially expressed gene pathways in GCs in different groups. c Differential gene mapping graph in cell cycle pathway of GCs in different groups

