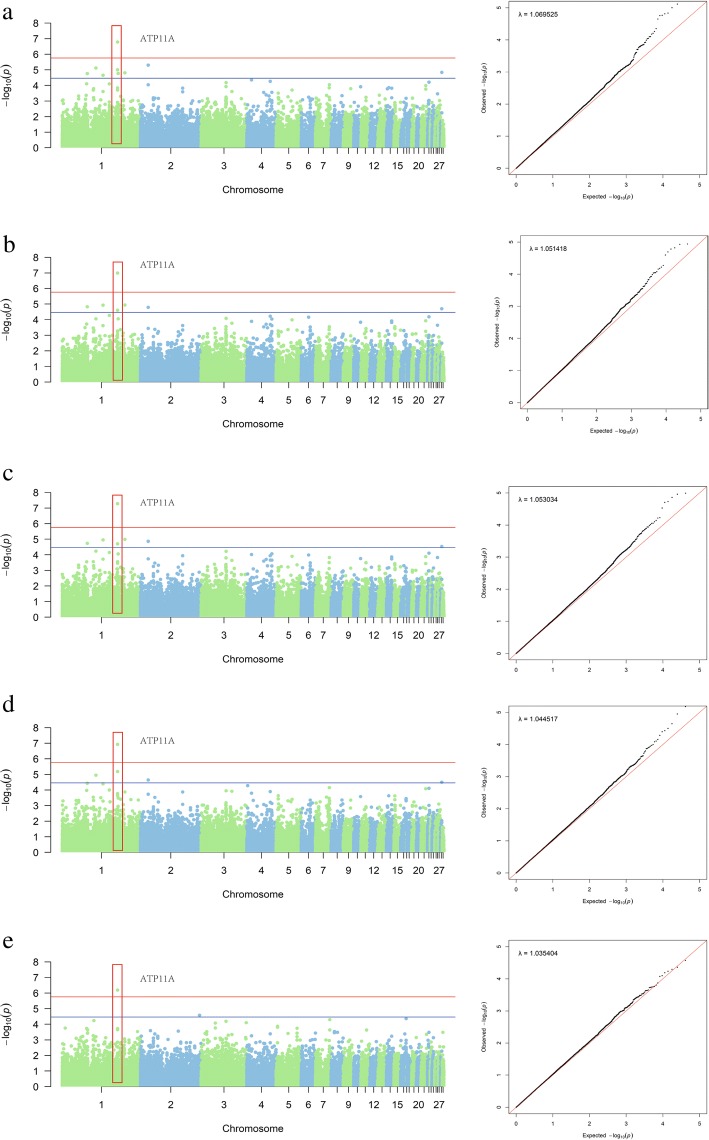
Fig. 1.
Manhattan plots showing associations of all SNPs with five traits and quantile-quantile (Q-Q) plots of the GLM (black dots) for five traits (a. DW, b. EW, c. HEW, d. BW42, e. WW). One SNP reached genome-wide significance for the five above traits. In Manhattan plots, SNPs are plotted on the x-axis according to their position on each chromosome, against association with these traits on the y-axis (shown as −log10P-value). Blue solid line indicates suggestive significance association (P = 3.48E− 05), and red solid line shows genome-wide significance with a P-value threshold of 1.74E− 06. In Q-Q plots, expected P-values under the null hypothesis are plotted on the x-axis and observed P-values on the y-axis. The estimated genomic inflation factor λ ranged from 1.03–1.06

