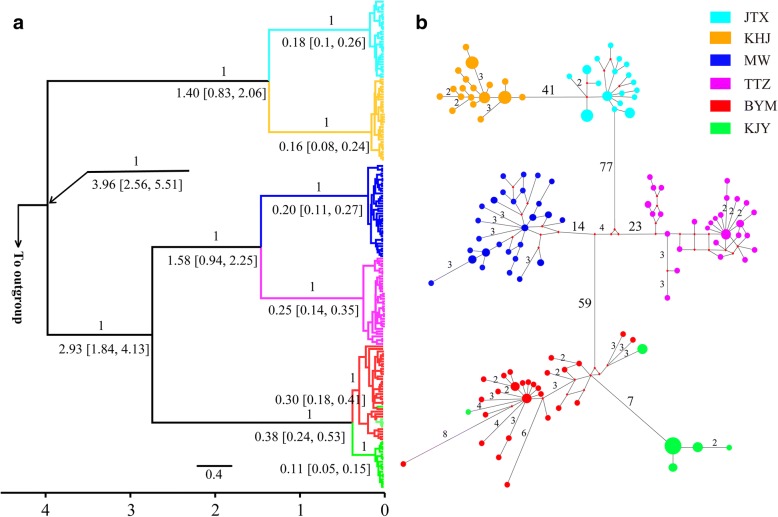
Fig. 2.
Phylogenetic relationships and haplotype network based on the mtDNA haplotypes of P. shangchengensis. a Phylogenetic tree of P. shangchengensis based on mitochondrial data. The numbers above branches are Bayesian Posterior Probabilities (BPP) indicating node support and the numbers underneath branches are split time estimates (Mya) with their 95% highest posterior density in square brackets; b Median-joining network with node sizes proportional by area to the frequencies of haplotypes. The numbers of mutations separating the haplotypes are shown on the branches, except for the one-step mutations. The little red diamond nodes indicate undetected haplotypes

