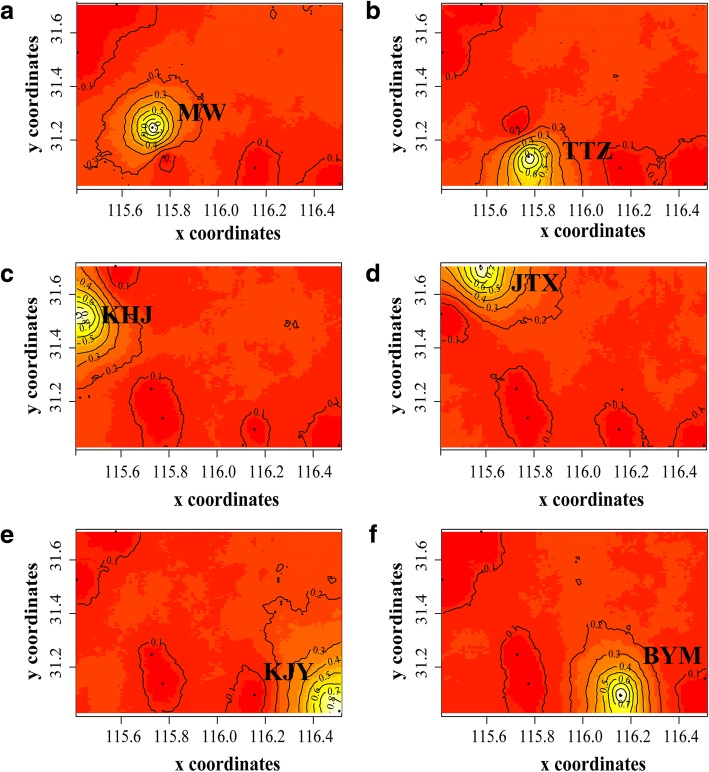
Fig. 4.
Spatial distribution of each group defined by Geneland for K = 6. a Cluster 1, b Cluster 2, c Cluster 3, d Cluster 4, e Cluster 5, and f Cluster 6. Clusters are indicated by areas with different intensities of color. Lighter-colored areas indicate a higher probability that individuals belong to that cluster

