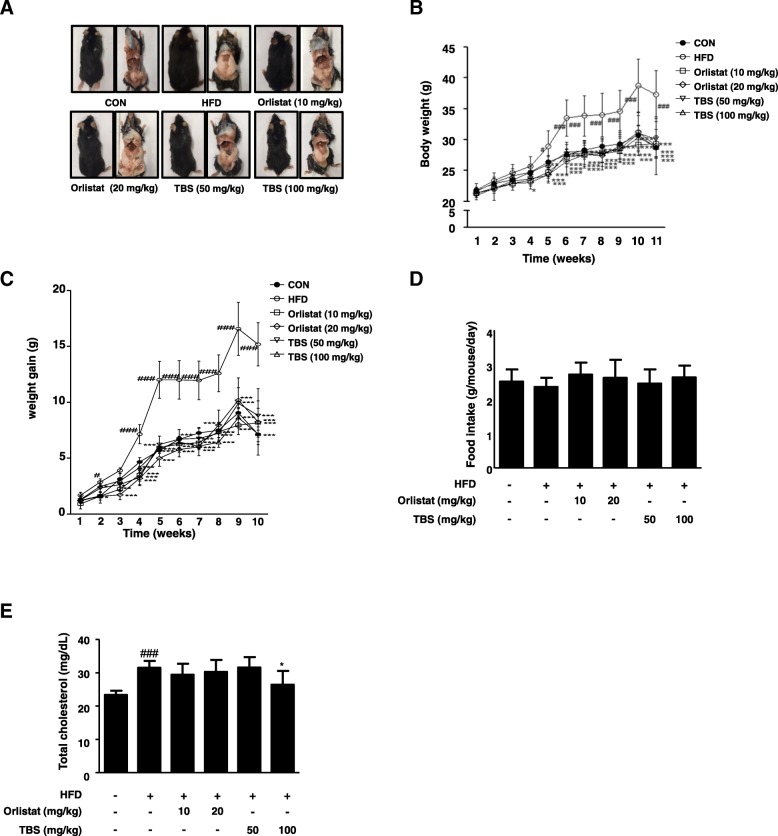
Fig. 1.
Effect of TBS on adipose tissue size and body weight in high-fat diet-induced obesity in C57BL/6 N mice. (a) Macroscopic mouse body and WAT size analysis. (b) Body weight and (c) body weight gain were assessed every week. (d) Food intake was recorded two or three times per one week. (e) The levels of serum TC were determined using enzymatic methods. CON: normal diet group; HFD: high-fat diet group; Orlistat: HFD plus orlistat (10 or 20 mg/kg) group; TBS: HFD plus TBS (50 or 100 mg/kg) group. The values represent the mean ± S.D. #p < 0.05 and ###p < 0.001 vs. the control group; *p < 0.05, **p < 0.01, and ***p < 0.001 vs. HFD group

