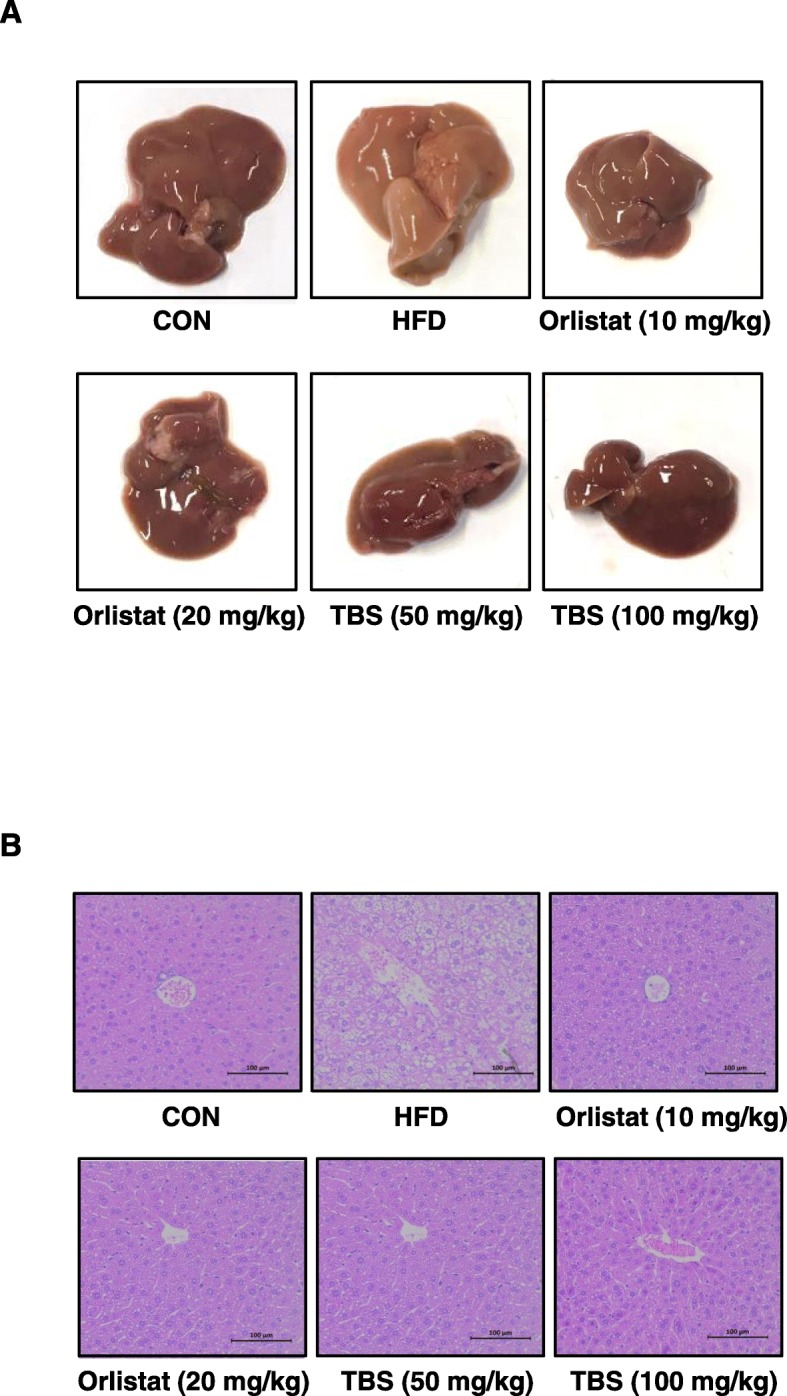
Fig. 5.

Effects of TBS on liver tissue morphology and lipid accumulation. (a) Macroscopic analysis of mouse liver tissue. (b) Liver tissue from representative mice in each group were fixed, embedded in paraffin, and stained with H&E solution. Images are shown at the original magnification of 100x. CON: normal diet group; HFD: high-fat diet group; Orlistat: HFD plus orlistat (10 or 20 mg/kg) group; TBS: HFD plus TBS (50 or 100 mg/kg) group. Scale bar is 100 μm
