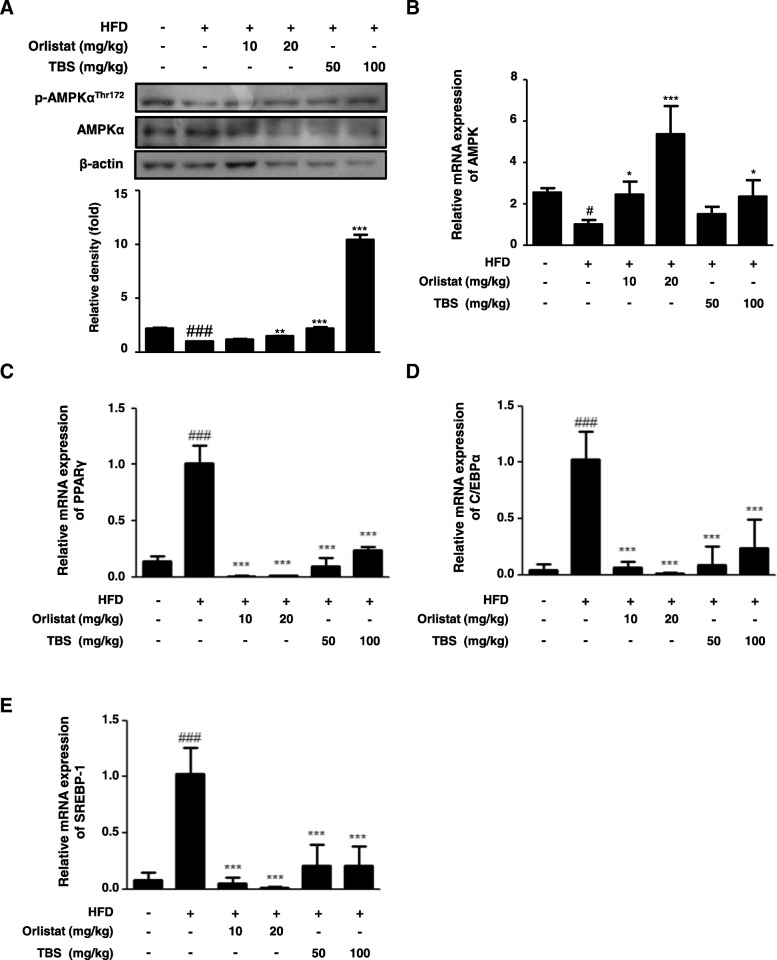
Fig. 6.
Effects of TBS on liver tissue the expression of p-AMPK, AMPK, PPARγ, C/EBPα, and SREBP1. Total protein and RNA prepared from liver tissue were used to measure the expression of protein of (a) p-AMPK and the levels of mRNA of (b) AMPK, (c) PPARγ, (d) C/EBPα, and (e) SREBP1 by western blotting and qRT-PCR. Densitometric analysis was performed using ImageJ ver. 1.50i. The values represent the mean ± S.D. of three independent experiments. #p < 0.05 and ###p < 0.001 vs. the control group; *p < 0.05, **p < 0.01, and ***p < 0.001 vs. HFD group

