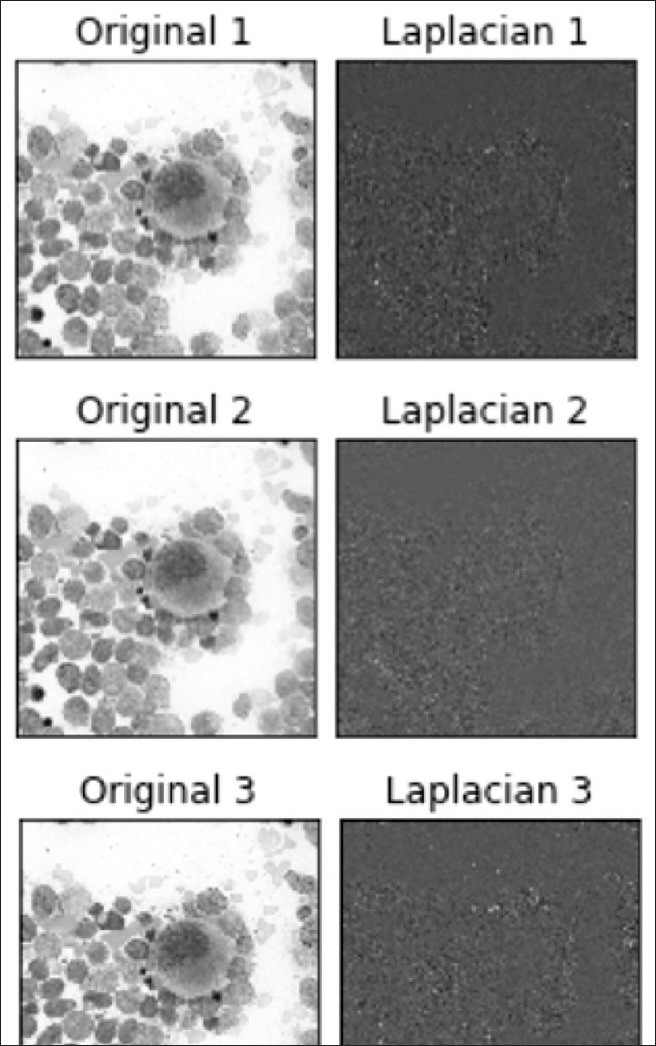
Figure 3.

Plot of Laplacian of Gaussian filter on three images at different z-levels. Different z-levels of the same region of interest (×400 magnification) with the Laplacian of Gaussian filter applied. The Laplacian of Gaussian filter results are seen to the right of each image
