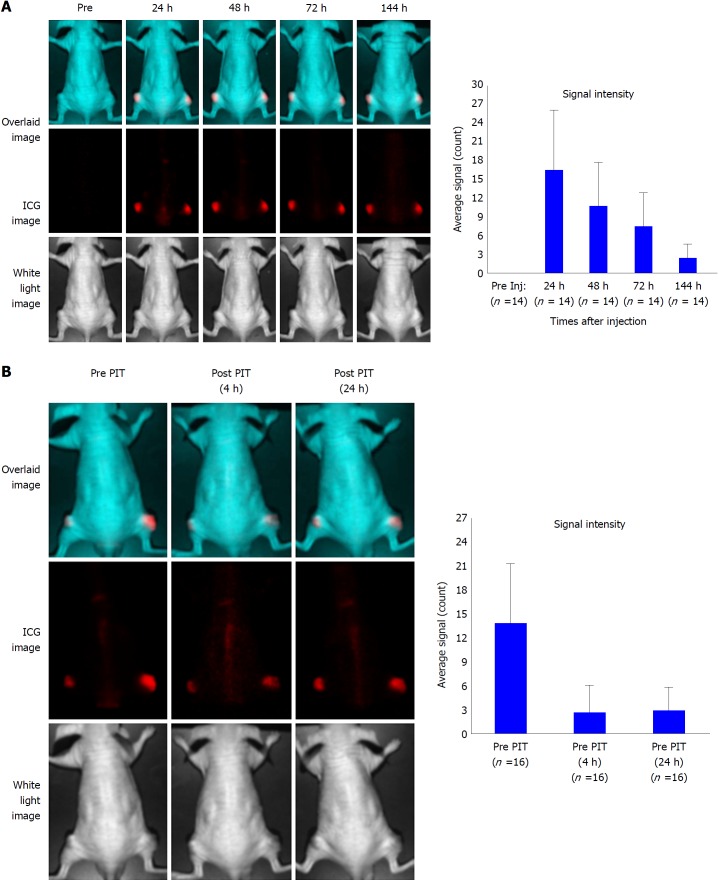
Figure 4.
Serial near-infrared fluorescence imaging of a representative mouse bearing xenografted tumor. A: Imaging was performed pre- and post- injection of indocyanine green (ICG)-labeled anti-tissue factor antibody 1849 (1849-ICG) at indicated time points (24, 48, 72, and 144 h). The upper panel shows the overlaid image of the ICG spectrum image (middle panel) and the white light image (lower panel). Fluorescent signal intensity of BxPC-3 tumors is higher than that of the whole body. Adjoining bar graph shows the ICG specific signal intensity of the tumors over time with the peak intensity at 24 h after the injection. Data are presented as mean ± SD (n = 14); B: Images of tumor bearing mice before photoimmunotherapy (PIT) (left); 2 h (center) and 24 h (right) after PIT. ICG signal intensity in the tumor decreased initially after PIT and was restored in 24 h suggesting re-accumulation of 1849-ICG due to circulating 1849-ICG. Bar graph shows the ICG signal intensity of tumor before and after near-infrared-PIT. Data are presented as mean ± SD (n = 16). 1849-ICG: Indocyanine green-labeled anti-tissue factor antibody 1849; NIR: Near-infrared; PIT: Photoimmunotherapy.

