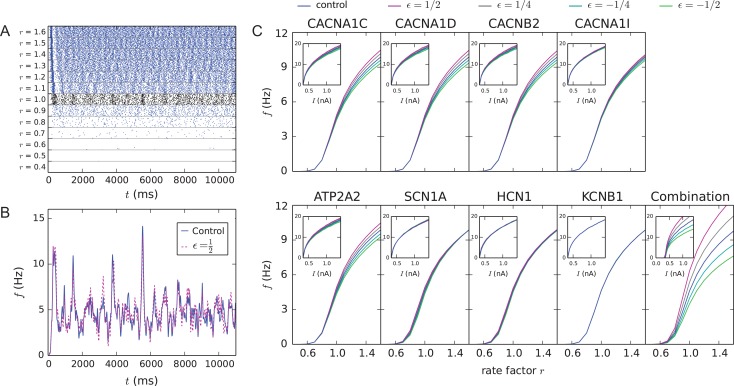
Figure 1.
Model variants affect network excitability. (A) Population spike trains for control networks with different event rates of background synaptic inputs. The black spike train shows the response of the model to the inputs used in the original model (Hay and Segev 2015), that is, when excitatory and inhibitory synapses were activated on average at frequencies f = 0.72 and 7.0 Hz, respectively (the distribution of the inter-event intervals was stationary Poisson). In the other examples, these rates were multiplied by the shown factor r. (B) Population firing rate of networks with r = 1.0 as a function of time, smoothened using a 25-ms Gaussian kernel. Blue curve shows the control network data, while the dashed magenta curve shows data from the CACNA1C model variant with ε = 1/2 scaling (corresponds to the CACNA1C variant of panel C). (C) Gain curves of variant networks, where the mean neuron-wise firing rate during an 11-s simulation is plotted against the rate factor r. Averaged over 3–10 samples. C, inset: f–I curves of single-L5PCs with the corresponding model variants (Mäki-Marttunen et al. 2016). These data were obtained by stimulating the neuron with a somatic DC with the amplitude shown on the x-axis—the y-axis shows the resulting spiking frequency (in Hz). Blue: control network (no variants), other colors: downscaled model variants with different downscaling parameters ε. The parameter changes related to each model variant are stated in Table S3.

