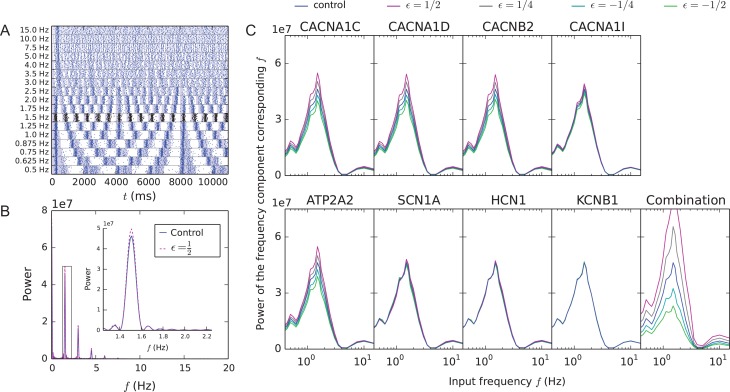
Figure 2.
Model variants affect the magnitude of the response of the network to oscillatory inputs. (A) Population spike trains for control networks where the event times of the background synaptic inputs were non-stationary (oscillatory) Poisson processes. The shaded areas show the times at which the λ of the oscillatory Poisson process was larger than average. The black spike train represents the L5PC network response to the input oscillation frequency 1.5 Hz, which caused the largest response in the network. (B) Fourier power spectra of the CACNA1C model variant (purple) and control (blue) network spike train with the input oscillation frequency 1.5 Hz. Only spikes from 2000 ms onward were considered when calculating these spectra. Inset: zoomed-in view on the peak at the frequency corresponding to the input oscillation. (C) The power of the frequency component corresponding to the input oscillation frequency (e.g., the amplitude of the peak in the inset of panel B) plotted against the input oscillation frequency. Averaged over 6–13 (mean 11.9) samples. Background oscillation frequencies f = 0.0625, 0.125, 0.1875, 0.25, 0.3125, 0.375, 0.4375, 0.5, 0.5625, 0.625, 0.6875, 0.75, 0.875, 1.0, 1.125, 1.25, 1.375, 1.5, 1.625, 1.75, 2.0, 2.5, 3.0, 3.5, 4.0, 5.0, 7.5, 10.0 and 15.0 Hz were considered. Blue: control network (no variants), other colors: downscaled model variants with different downscaling parameters ε.

