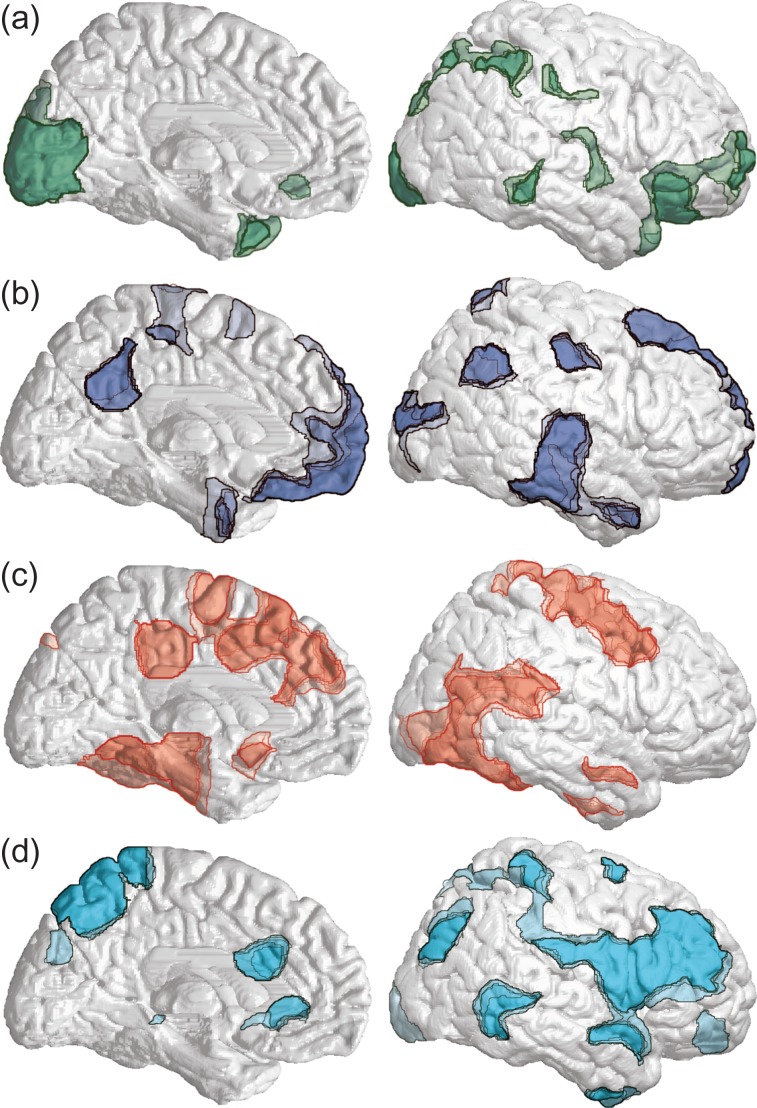
Figure 7.
Anatomical regions are conserved across consecutively greater cluster levels. The boundaries of each corresponding cluster in a series are overlaid, with darker colors indicating greater spatial overlap across cluster levels. (a) Clusters with high temporal correlation to Cluster 1 from Figure 6. (b) Clusters with high temporal correlation to Cluster 2. (c) Clusters with high temporal correlation to Cluster 3. (d) Clusters with high temporal correlation to Cluster 4. Criteria for temporal correlations were Pearson’s correlation coefficient >0.95 and P < 0.0001. Regions shown are from k-means clustering with number of clusters ranging from 4 through 10. Data and subjects were the same as Perceived trials in Figure 5. See also Supplementary Figure S6.

