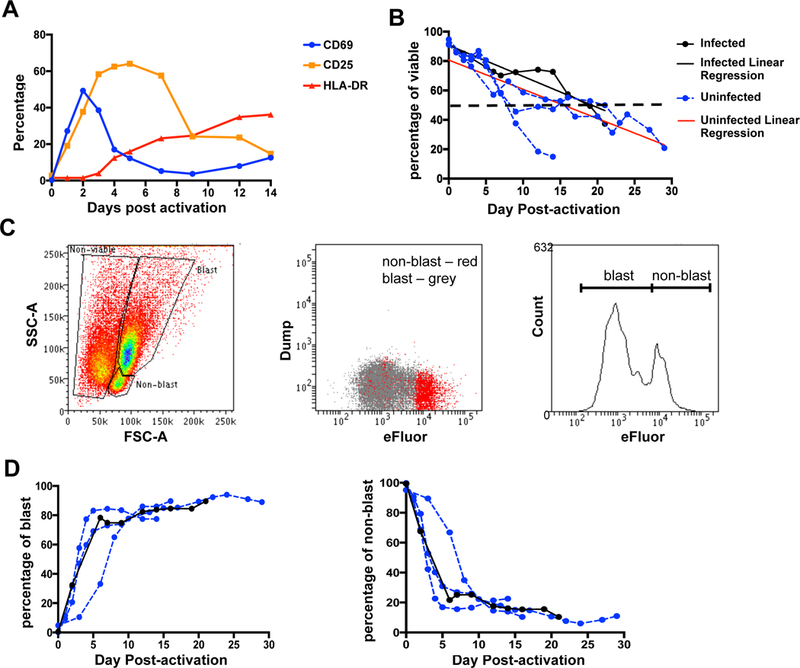
Fig. 2. The phenotype and viability of CD4+ T cells during long-term culture.

A. Kinetics of expression of T cell activation markers following stimulation with PHA/IL-2. Primary resting CD4+ T cells were activated with PHA in the presence of IL-2 and the percentage of CD69 (blue), CD25 (orange) and HLA-DR (red) in the viable cell population was measured by flow cytometry. Data represent the mean from two individual donors. B. Resting CD4+ T cells were activated with PHA/IL-2 with or without infection with WT-LTR VSV-G pseudotyped pGBFM virus and cell viability was measured by flow cytometry. Linear regression of the uninfected (red line) and infected (black line) donors is also shown. C. Gating strategy to determine the proportion of non-blast, blast and non-viable cells by flow cytometry based on forward- and side-scatter (FSC and SSC, respectively). A representative flow plot of cells collected 12 days post-activation, prior to sorting is shown. Cells stained with the proliferation dye, eFluor, were also used to confirm the gating strategy. D. Percentage of blast and non-blasts over time is shown. Percentage was calculated based on the total number of viable cells. Each line represents an individual donor.
