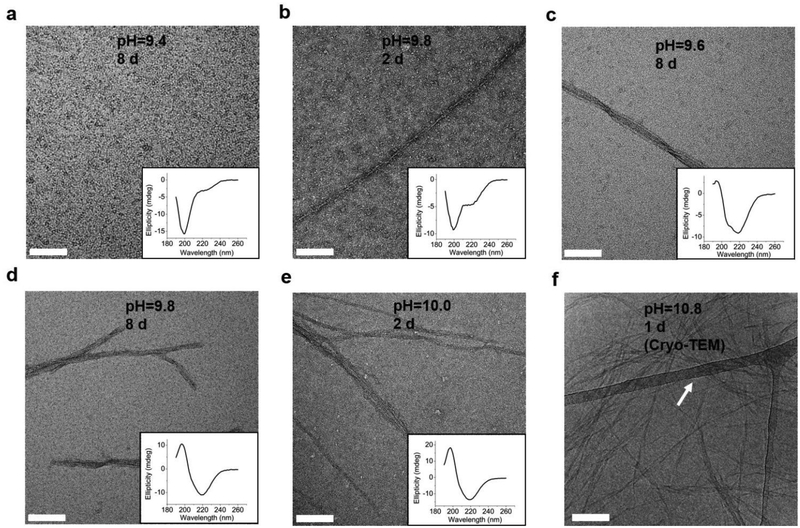
Fig. 3.
TEM images of negatively stained 0.1 mM L-GL13K agglomerations or self-assembled supramolecular structures (nanofibrils and nanoribbons) in buffer solutions of (a) pH 9.4 after 8 d, (b) pH 9.8 after 2 d, (c) pH 9.6 after 8 d, (d) pH 9.8 after 8 d, (e) pH 10.0 after 2 d. The inset plots are the corresponding CD spectra. (f) Cryo-TEM image of 1 mM L-GL13K nanoribbons in buffer solution at pH 10.8 for 1 d. The nanoribbons were embedded in vitreous ice and the arrow points at the lacey carbon/formvar support grid. All scale bars are 100 nm.

