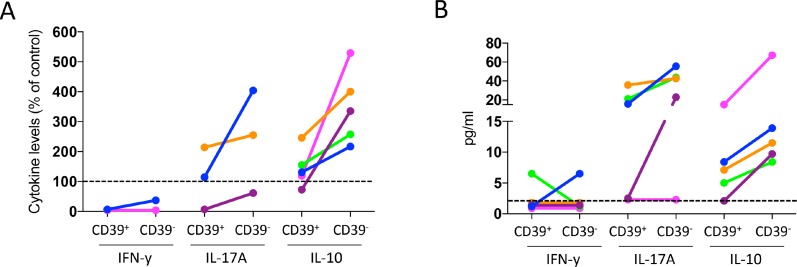
Figure 6. Effect of CD39+ and CD39− Treg on cytokine production by conventional CD4+ T cells.
PBMC isolated from buffy coats were enriched for monocytes by immunomagnetic sorting, and for conventional T cells (CD4+CD127+CD25−) and CD39+ and CD39- Treg (CD4+CD127loCD25hi) by flow cytometric cell sorting, and stimulated with anti-CD3 mAb. IFN-β, IL-17A and IL-10 concentration was analyzed by MAGPIX array after two days of culture, with responder cells and sorted CD39+ or originally CD39− Treg at a 1:1 ratio (n = 5). Data are expressed as % of the cytokine levels compared to cultures without Treg (A). Individuals with no detectable cytokine levels in the cultures without Treg were excluded. Cytokine levels in cultures with CD39+ and originally CD39- Treg are displayed as absolute values for all individuals (B), dotted line indicates lowest detectable concentration. Individuals are consistently color-tagged between graphs.

