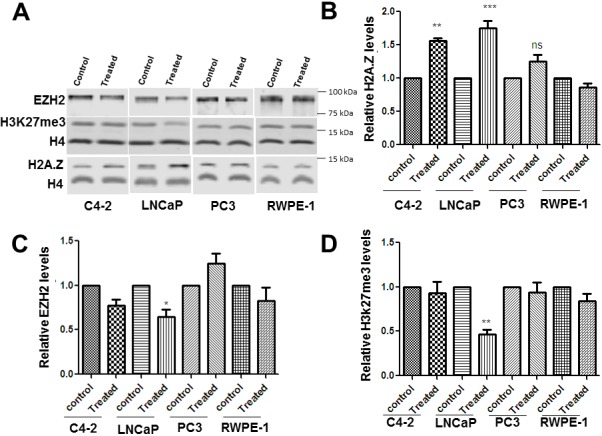
Figure 2. Metformin exposure alters the levels of H2A. Z, EZH2 and H3K27me3 levels in PCa cells.

Four prostate cell lines (C4-2, LNCap, Pc-3 and RWPE-1) were treated with 2 mM metformin for 24hrs. (A) Representative western blot analyses for H2A.Z, EZH2, H4 and H3K27me3 obtained from cell protein lysates of metformin treated and untreated (control) cells. (B, C and D) Bar-plot representation of the western blot data obtained from four independent experiments normalized using H4. Student’s t- tests were used to calculate significance; P value, * P < 0.05, **P < 0.01, ***P < 0.001.
