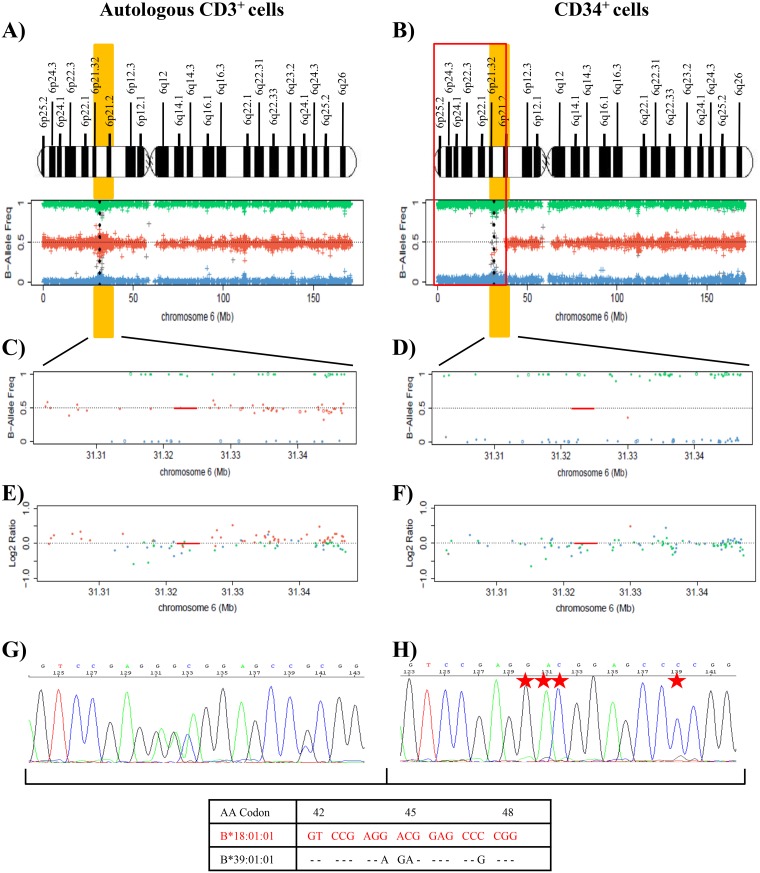
Figure 2. Results of SNP array on chromosome 6 and of the HLA Sanger sequencing of the patient 10.
(A) and (B) These plots show the frequency of the B allele in CD3+ control cells (A) and CD34+ cells (B) in total chromosome 6, which indicates the allelic composition of each single-nucleotide polymorphism (SNP). BB genotypes have a B allele frequency of 1, AB genotypes a frequency of 0.5, and AA genotypes a frequency of 0. A schematic representation of chromosome 6 is included above the SNP array plots. HLA region is shown in chromosome 6p21.1-21.3 (yellow). Black points in SNP array plot indicate the position of the HLA-B locus in chromosome 6. A terminal deletion of 38 Mb (indicated in red) that involves HLA loci in CD34+ cells is detected in comparison to controls. (C) and (D) Plots for amplification of 6p21 region that involves HLA-B locus (red line), showing the frequency of the B allele in CD3+ control cells (C) and CD34+ cells (D). SNP array results indicate a homozygosity pattern (genotypes AA=1 and BB=1) in CD34+ fraction. (E) and (F) Plots of logR ratio in CD3+ control cells (E) and CD34+ cells (F), a measure of the copy number for each SNP. CD34+ cells conserved the copy number (logR ratio=0) along chromosome 6. The lack of heterozygous genotypes across the p arm of chromosome 6 in the absence of an alteration in copy number in the leukemic cells indicates CN-LOH. (G) and (H) Fragment of the sequencing electropherogram of exon 2 (codon 42 to codon 48) in the HLA-B locus of patient 10. In CD34+ cells (H) a loss of heterozygosity in polymorphic positions (red stars) in exon 2 in comparison to CD3+ cells (G). The nucleotide sequence detected in CD34+ cells corresponds to HLA-B*18:01 allele (red), while allele HLA-B*39:01 is lost.

