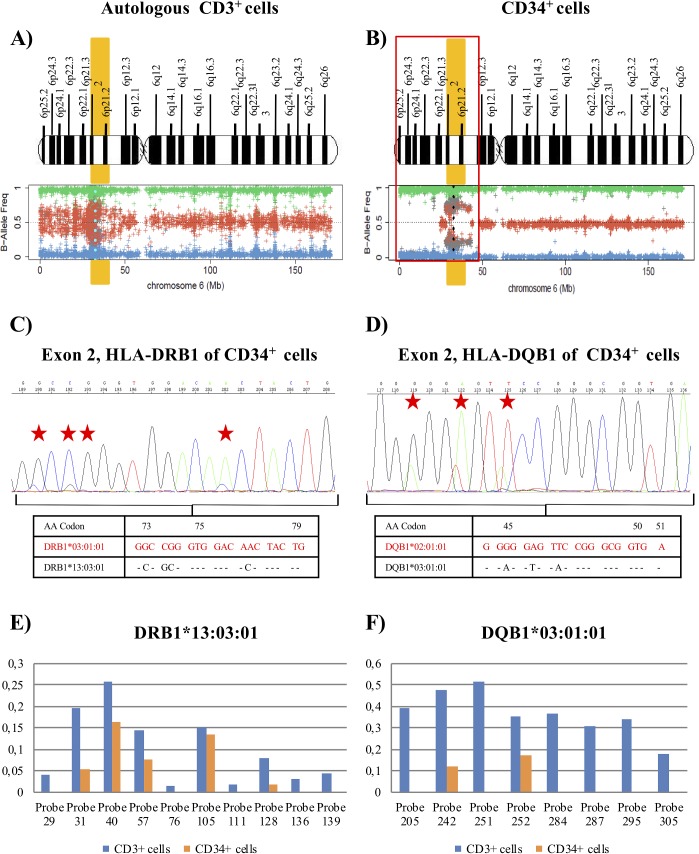
Figure 3. Results of SNP array on chromosome 6 and the HLA Sanger sequencing of the patient 9.
(A) and (B) See Figure 2 footnotes for the interpretation of SNP array plots. Blue (CD3+ cells) and black (CD34+ cells) points in the SNP array plot of chromosome 6 show the position of the HLA-DRB1 locus in CD3+ control cells (A) and CD34+ cells (B). We detected a terminal deletion of 40 Mb (indicated in red) that involves HLA loci in CD34+ cells. We detected a small region telomeric to the HLA loci that retained heterozygosity (Eliminate these words from the text). (C) and (D) Fragment of the sequencing electropherogram of exon 2 (codon 73 to codon 79) of HLA-DRB1 locus (C) and exon 2 (codon 44 to codon 51) of HLA-DQB1 locus (D) in CD34+ cells. The height of peaks at polymorphic sites (red stars) of the nucleotide sequence, corresponding to the DRB1*13:03 alleles and DQB1*03:01 alleles, was reduced in comparison to the signal intensity of the sequence for DRB1*03:01 and DQB1*02:01 alleles (red), suggesting that the LOH detected was not present in all leukemic blasts in the purified sample. (E) and (F) Representation of the difference between the adjusted median fluorescence intensity (MFI) value of the informative sequence-specific oligonucleotide (SSO) probes and the cut-off values for alleles (E) DRB1*13:03 and (F) DQB1*03:01 in CD34+ cells in comparison to CD3+cells, obtained for HLA typing using Luminex technology. The values represented were next or lower than the value of the cut-off in most SSO probes in CD34+ cells. The adjusted values for the different probes corresponded to: (MFI probe – MFI blank probe) / (MFI control probe – MFI blank control probe), according to manufacturer's instructions.

