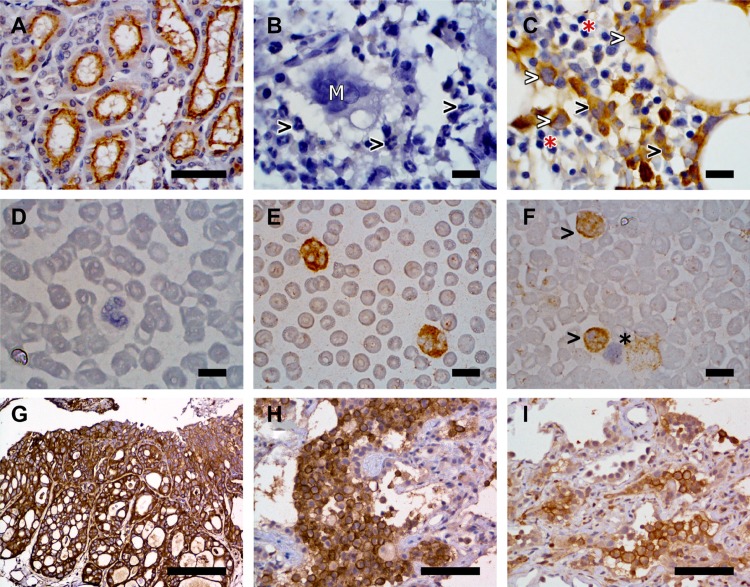
Figure 4.
Representative examples of FR expression detected on canine kidney (A), canine bone marrow sections (B, C), canine peripheral blood smears (D, E, F), and canine iUC (G, H, I). FR expression was detected by immunohistochemistry in panels (A–C) and (G–H), and by immunocytochemistry in panels (D–F). (A) Canine kidney used as a positive control. Immunoreactivity is detected on the apical surface of the proximal renal tubular epithelium. Image taken at 40× magnification. Scale bar = 50 µm. (B) Canine bone marrow section used as negative control. Note the absence of immunoreactivity in granulocytes (black arrowheads) and megakaryocytes (white “M”). (C) Paired bone marrow sample showing FR expression by early myeloid precursor cells (white arrowheads) and granulocytes (black arrowhead). Erythroid precursors (red asterisk) do not display immunoreactivity. (D) Canine peripheral blood smear negative control. (E) Paired specimen showing marked cytoplasmic and membranous immunoreactivity in granulocytes. (F) Absence of FR immunoreactivity on lymphocytes (black asterisk) contrary to positive immunoreactivity on granulocytes (black arrowheads). Images B to F were taken at 100× magnification. Scale bars = 10 µm. (G) Canine iUC, urinary bladder. Strong labeling of neoplastic cells for FR is observed. Scale bar = 200 µm. (H and I) Pulmonary metastases of canine iUC. Note the uneven labeling for FR. Scale bar = 75 µm. All images were collected with an Eclipse E400 microscope equipped with a Plan Fluor 40×/0.75 and a Nikon Plan Fluor 100×/1.30 oil objectives. Images were acquired with a DS-Fi2 camera controlled with the Digital Sight DS-L3 controller and the NIS-Elements F (4.60.00 version) software. Figures were prepared using the GIMP (version 2.8.22 version) image processing software.

