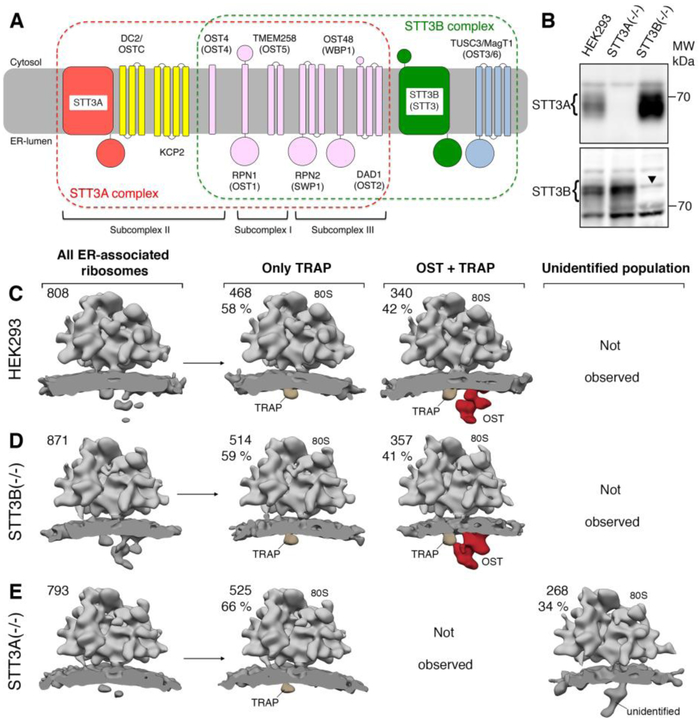
Fig. 1. RTCs harbor exclusively STT3A complexes.
(A) Schematic representation and membrane topology of OST subunits for the STT3A (red frame) and STT3B complexes (green frame, yeast names in parentheses). Shared subunits are depicted in pink. OST subcomplexes are indicated for the STT3A complex. (B) Microsomes from wild type or mutant HEK293 cells were analyzed by immunoblotting using rabbit polyclonal antibodies. The arrowhead in the STT3B blot designates a nonspecific background band. (C)-(E) Ribosome-bound translocon populations observed for microsomes from wild type HEK293 (C), STT3B(−/−) (D) and STT3A(−/−) (E) cell lines after in silico sorting. The absolute number and ratio of subtomograms contributing to each class are given. All densities were filtered to 30 Å resolution.

