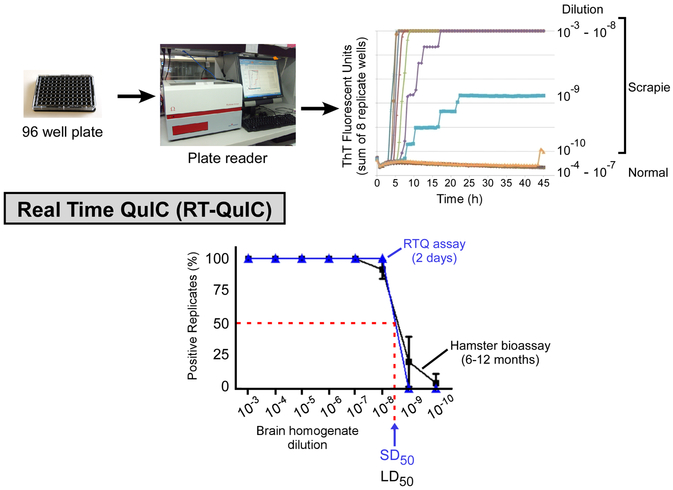
Figure 3. Diagram of Real Time QuIC (RTQ) and comparison of end-point dilution titrations of scrapie brain homogenate by RTQ compared to animal bioassay.
(Top panel) RTQ analysis of normal and scrapie brain homogenate (BH) dilutions using hamster (90–231) rPrPC as a substrate. (Bottom panel) Comparison of hamster brain homogenate end point dilution titrations by RTQ and animal bioassay. The Spearman-Kärber estimate of the SD50 (i.e. seeding dose giving sufficient Thioflavin T fluorescence in half of the replicate wells) per 2 µl of neat brain tissue is indicated. Graphs adapted from Ref. [62].

