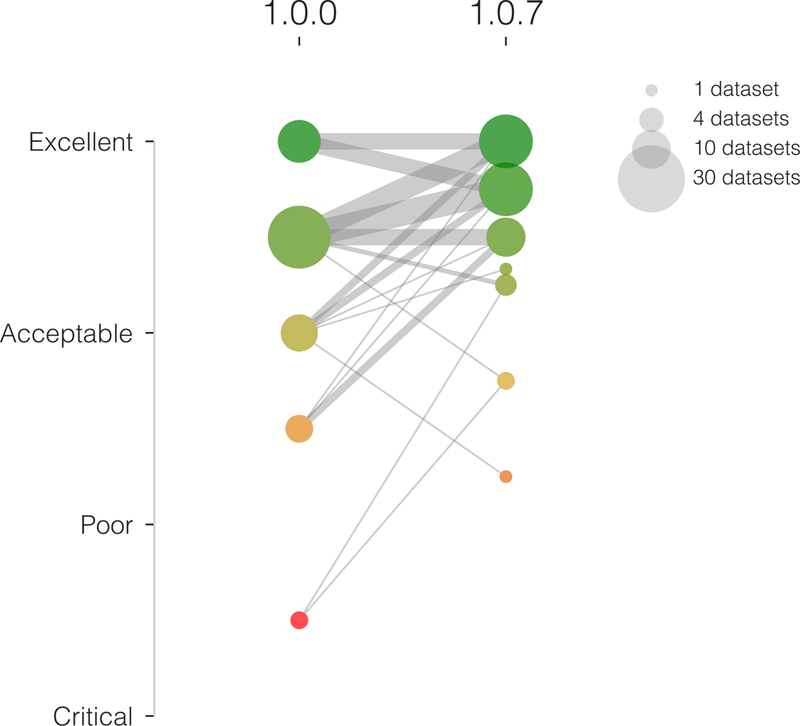
Figure 2. Integrating visual assessment into the software testing framework effectively increases the quality of results.

In an early assessment of quality using fMRIPrep version 1.0.0, the overall rating of two datasets was below the “poor” category and four below the “acceptable” level (left column of colored circles). After addressing some outstanding issues detected by the early assessment, the overall quality of processing is substantially improved (right column of circles), and no datasets are below the “poor” quality level. Only two datasets are rated below the “acceptable” level in the second assessment (using fMRIPrep version 1.0.7).
