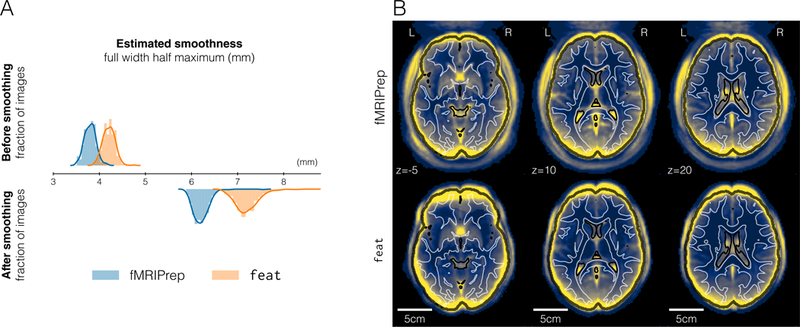
Figure 3. FMRIPrep affords the researcher finer control over the smoothness of their analysis.

A | Estimating the spatial smoothness of data before and after the initial smoothing step of the analysis workflow confirmed that results of preprocessing with feat are intrinsically smoother. B | Mapping the standard deviation of averaged BOLD time-series displayed greater variability around the brain outline (represented with a black contour) for data preprocessed with feat. This effect is generally associated with a lower performance of spatial normalization28. Reference contours correspond to the brain tissue segmentation of the MNI atlas.
