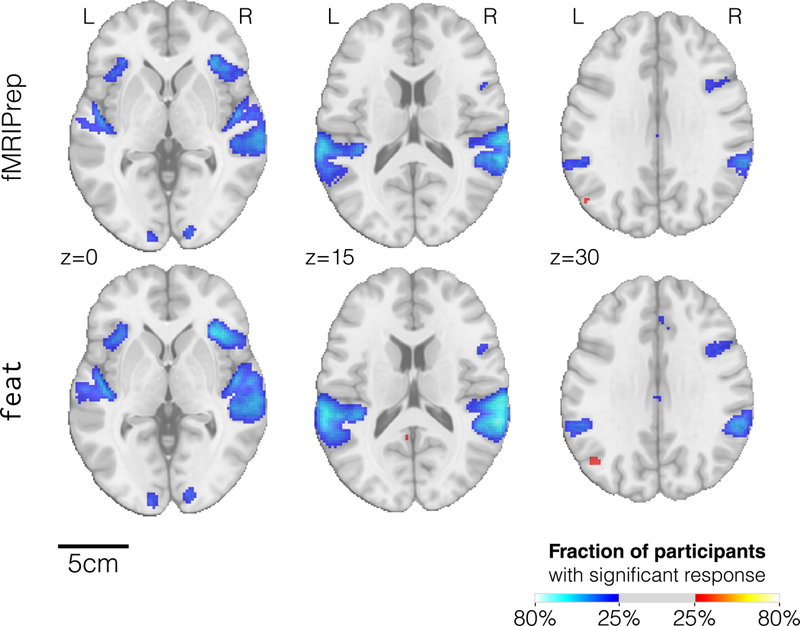
Figure 4. The activation count maps from fMRIPrep are better aligned with the underlying anatomy.

The mosaics show thresholded activation count maps for the go vs. successful stop contrast in the “stopsignal” task after preprocessing using either fMRIPrep (top row) or FSL’s feat (bottom row), with identical single subject statistical modeling. Both tools obtained similar activation maps, with fMRIPrep results being slightly better aligned with the underlying anatomy.
