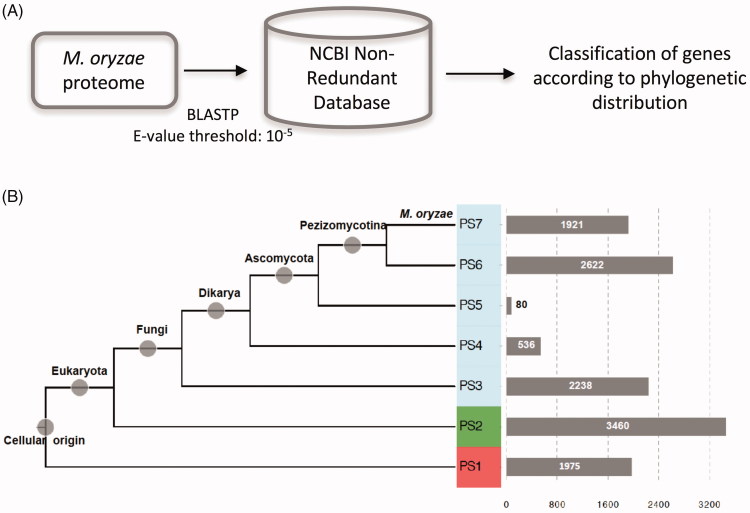
Figure 1.
Estimation of gene emergence time through phylogenetic distribution of genes using BLASTP search. (A) Diagram summarizing the process of gene emergence time estimation. (B) Summary of phylogenetic distribution of genes according to BLASTP results. Nodes marked by gray circle represent evolutionary lineages leading to Magnaporthe oryzae. Phylostrata corresponding to fungal lineages were shaded with light blue. Horizontal bars represent number of genes that fall in the corresponding phylostrata.

