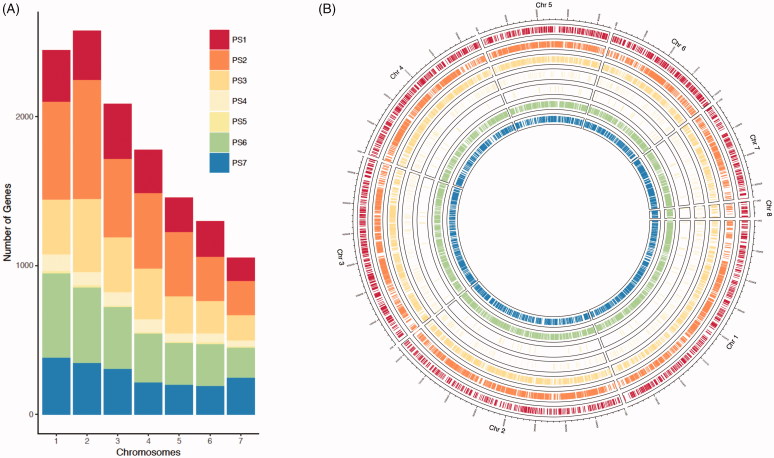
Figure 2.
Distribution of genes belonging to different phylostrata across and within seven chromosomes of Magnaporthe oryzae. (A) Distribution of genes across fungal chromosomes. Number of genes that correspond to individual phylostrata was marked by color codes. (B) Circular representation of gene distribution within chromosomes. Lines within each track represent genes in a particular phylostratum. The same color codes as in (A) were applied to the circular representation.

