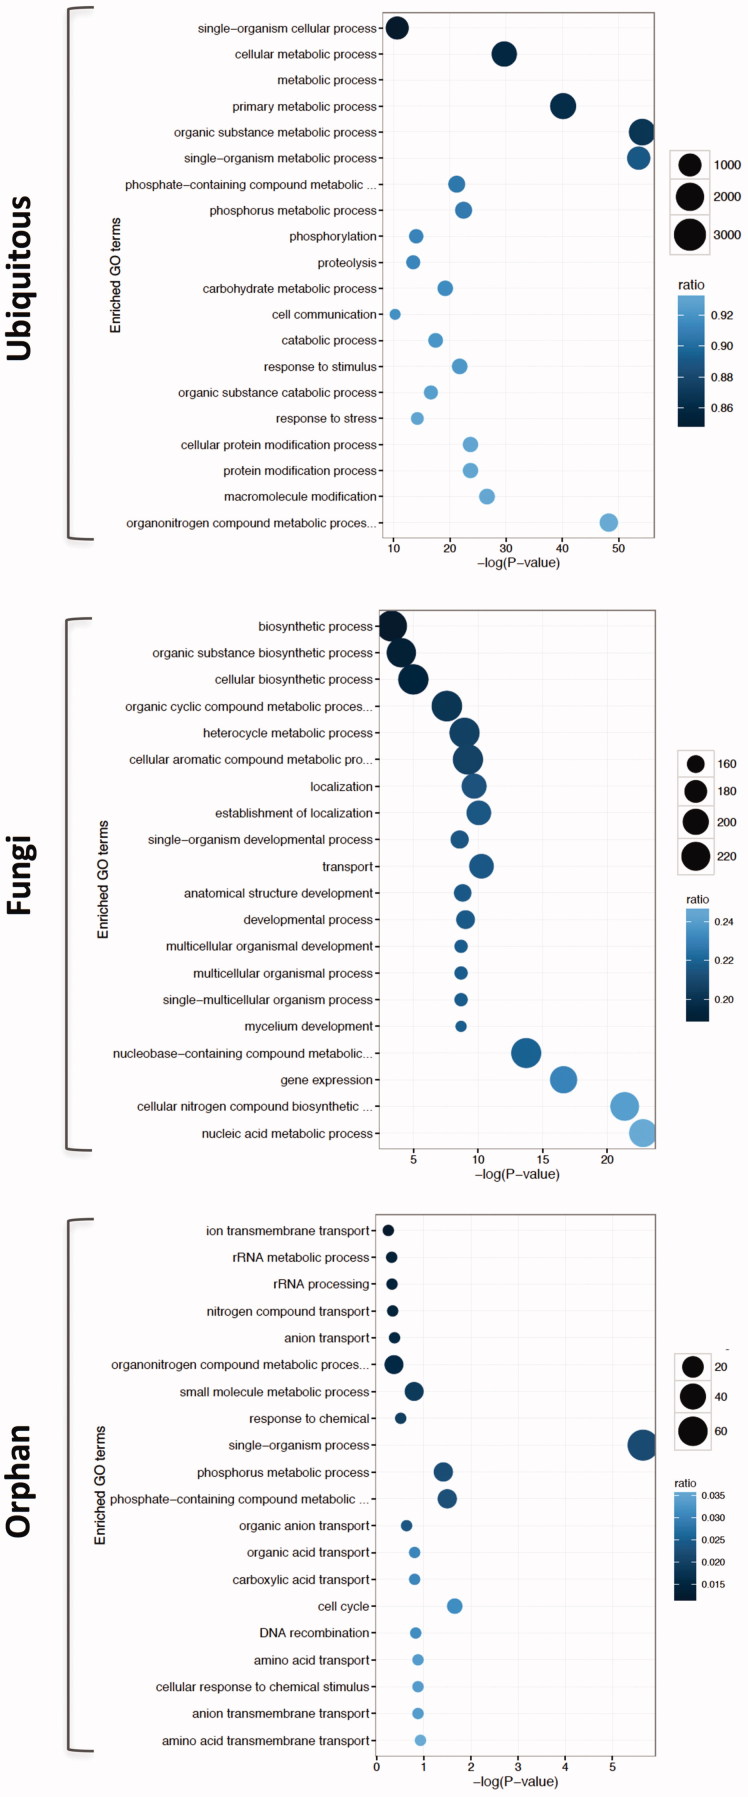
Figure 4.
Summary of GO enrichment analysis (biological process) for Ubi, Fungi, and Orphan groups. GO terms that are enriched with a particular group of genes are shown (Fisher’s exact test, P < 0.01). Area of circle represents the number of genes assigned to the particular GO term. Color of the circle indicates the proportion of genes assigned to the GO term in our data set among the total number of genes having that GO term in the genome.

