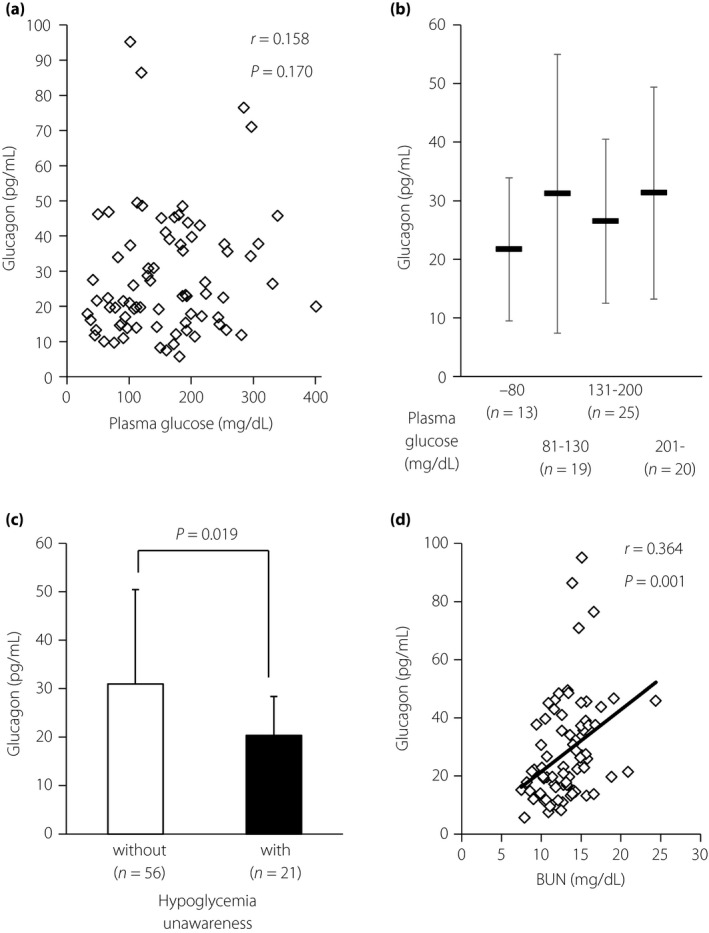
Figure 1.

(a) Values of plasma glucose and glucagon in participants with type 1 diabetes (n = 77). Squares indicate individual samples. (b) Levels of plasma glucagon in participants with type 1 diabetes. Data are expressed as mean ± standard deviation. (c) Plasma glucagon levels in patients without (white, n = 56) and with (filled, n = 21) a history of hypoglycemia unawareness. Statistical analysis for comparison was carried out using the unpaired Student's t‐test. Data are expressed as mean ± standard deviation. (d) Association between serum blood urea nitrogen (BUN) and glucagon concentrations (n = 77). Squares indicate individual samples, and the line indicates the approximate straight line. Statistical analysis for correlation was carried out using Pearson's univariate test.
