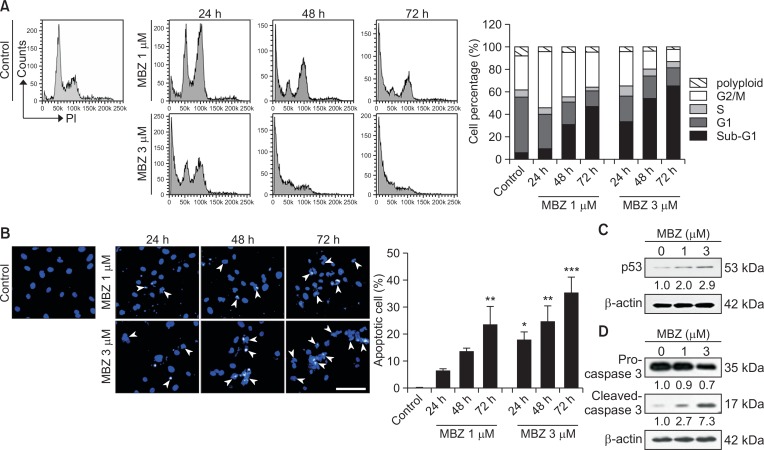
Fig. 3.
Mebendazole induces G2-M arrest and apoptosis in ECs. (A, B) HUVECs were treated with MBZ (1, 3 μM) for 24, 48 and 72 h, respectively. (A) The distribution of cell cycle was exhibited by flow cytometric analysis (left panel). Comparative quantification of cell percentage in different cell cycle phases is shown by bar diagram (right panel). (B) Cells were fixed and stained with DAPI. Apoptotic cells with chromatin condensation and nuclear fragmentation (arrow heads) were observed in MBZ treated cells and percentage of cells were calculated as the number of cells with apoptotic nuclei divided by the total number of cells in each 3 random field. Scale bar: 100 μm. *p<0.05, **p<0.01, and ***p<0.001 vs. control (MBZ 0 μM) group. (C, D) HUVECs were cultured with or without MBZ (1, 3 μM) for 24 h. Western blot analysis shows p53 (C), pro-Caspase 3 and cleaved-Caspase 3 (D) levels in HUVECs. β-actin was used for a loading control. The numbers indicate relative expression level compared with β-actin.

