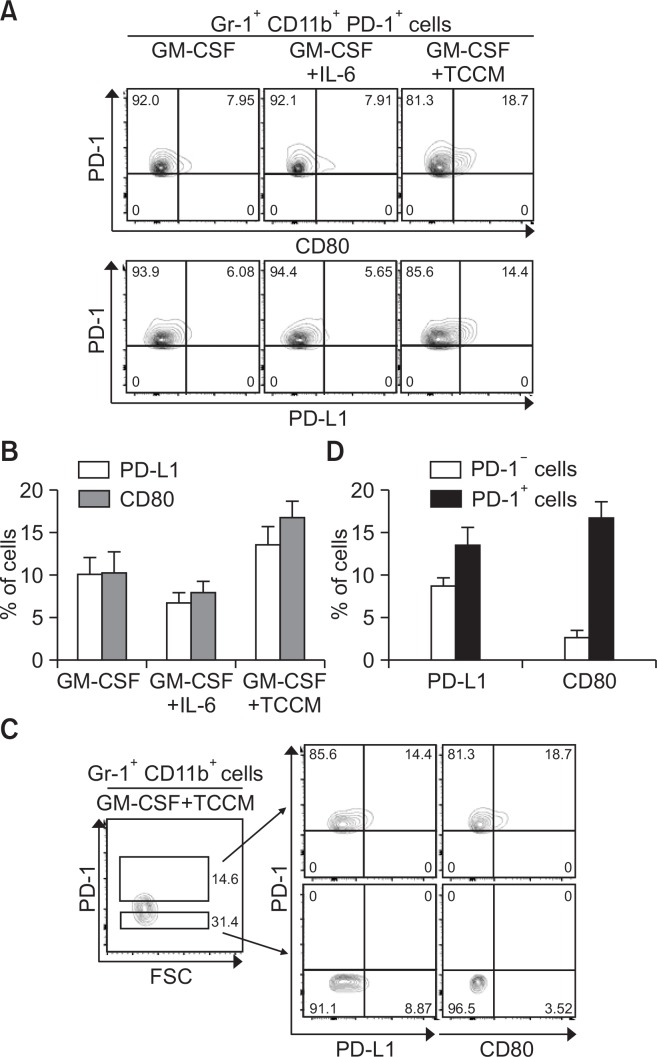
Fig. 3.
Increased expression of PD-L1 and CD80 in tumor-induced PD-1+ MDSCs. (A–D) Bone marrow cells were obtained from the femurs of Balb/c mice, and then CD11b+ cells were sorted. (A, B) The CD11b+ cells were cultured in fresh medium in the presence of 10 ng/ml GM-CSF, in the absence or presence of IL-6 or TCCM. The cells were collected on day 4 for cell analysis. Dot plots show PD-L1 and CD80 expression in Gr-1+ CD11b+ PD-1+ cells. (C, D) The CD11b+ cells were cultured in fresh medium in the presence of 10 ng/ml GM-CSF and TCCM. After 4 days, the cells were stained with specific antibodies against Gr-1, CD11b, and PD-1 and analyzed by flow cytometry. Dot plots show the PD-L1 and CD80 expression on cells after gating of Gr-1+ CD11b+ PD-1+ or Gr-1+CD11b+ PD-1− cells. All experiments were independently repeated at least 3 times.

