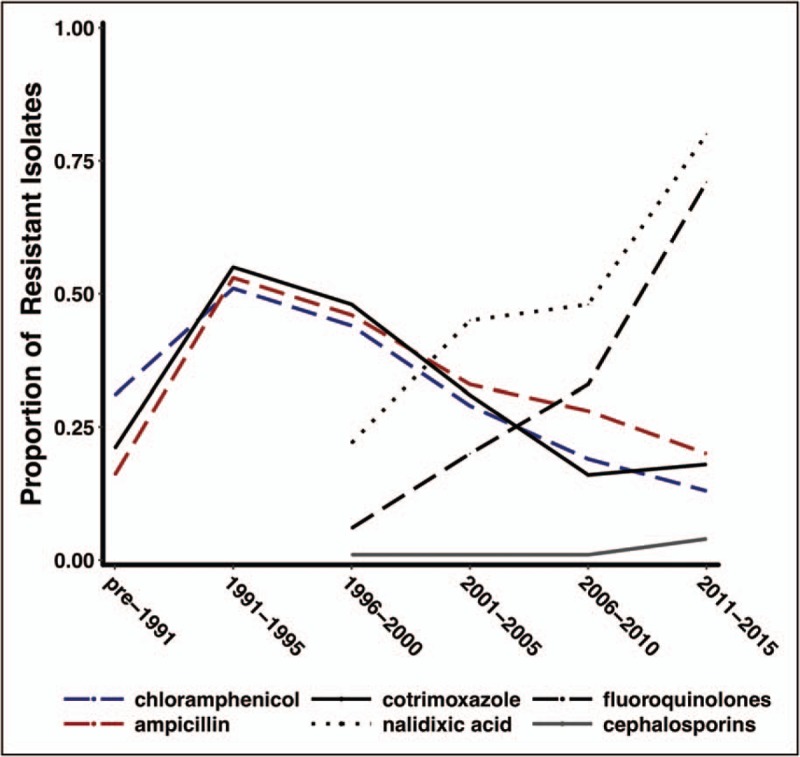
FIGURE 1.

Trends in antimicrobial susceptibility of S. Typhi over time. The graph illustrates the proportion of a global collection of S. Typhi isolates resistant to different antimicrobial agents, systematically consolidated from published reports from endemic and epidemic sources (1973–2015).
