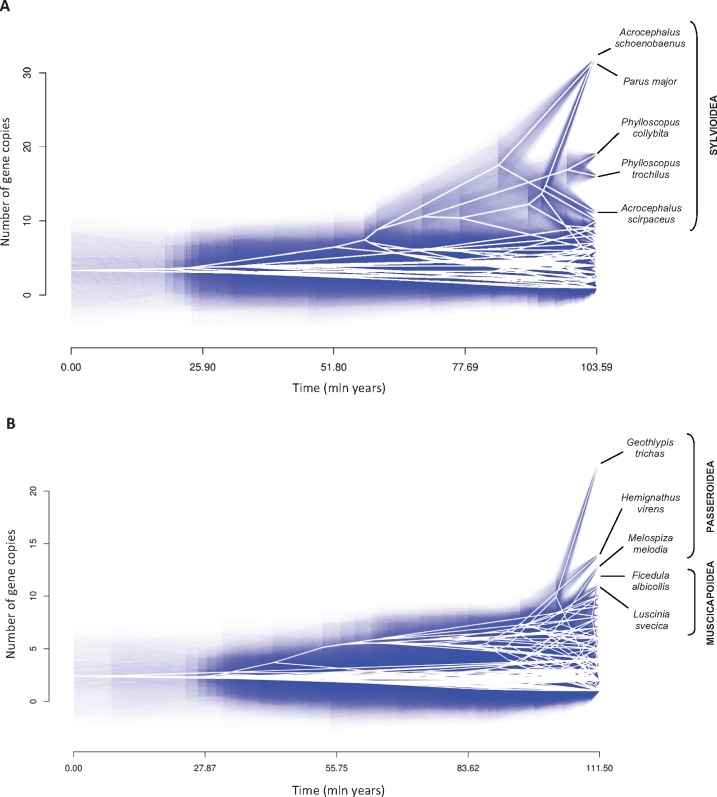
Fig. 2.—
Traitgrams for gene copy number at MHC class I (A) and class II (B) of birds. The vertical position of nodes shows reconstructed ancestral states for the number of MHC gene copies, while the horizontal position gives time from the root. Uncertainty is shown via increasing transparency of blue lines plotted along branches and at nodes which indicate 95% confidence intervals point estimates.

