Fig. 3.—

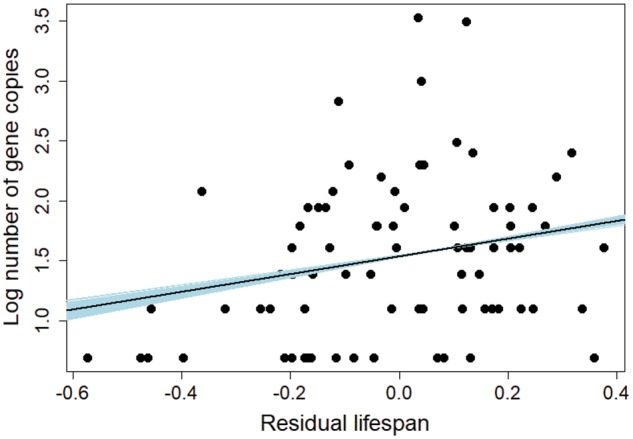
Relationship of gene copy number at MHC class I with residual lifespan of birds. Regression lines for 1,000 random phylogenies are marked with blue, and regression line averaged across these phylogenies is marked with black.

Relationship of gene copy number at MHC class I with residual lifespan of birds. Regression lines for 1,000 random phylogenies are marked with blue, and regression line averaged across these phylogenies is marked with black.