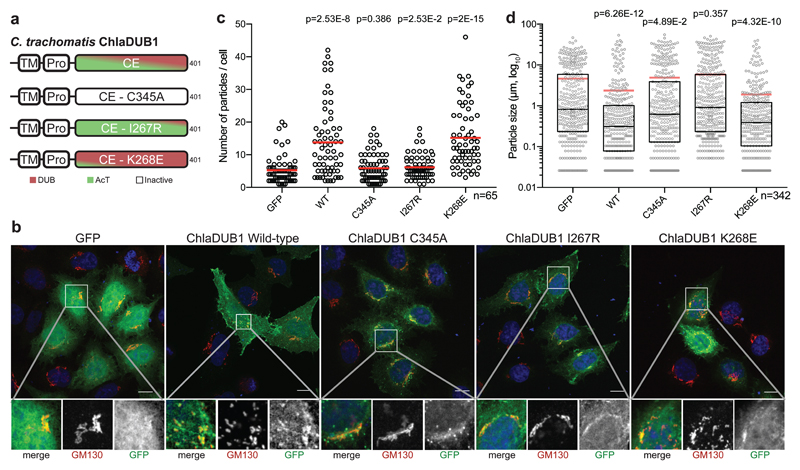
Figure 4. ChlaDUB deubiquitinase activity is required for C. trachomatis Golgi fragmentation.
a) Topology diagram illustrating the constructs used to characterize activity dependence of Golgi fragmentation following expression of ChlaDUB1 in mammalian cells. Separation-of-function mutations were selected from structural and biochemical work discussed in Fig. 2. b) Representative confocal images showing Golgi fragmentation in HeLa cells following expression of GFP-tagged ChlaDUB1. Samples were immunostained with anti-GM130 (cis-Golgi, red) and DAPI stained (DNA, blue). GFP fluorescence is shown in green. Isolated channels for the boxed region are shown below, and full versions are shown in Supplementary Fig. 7b. Scale bar corresponds to 10 µm. c) Quantification of cis-Golgi-stained puncta from b) for ~65 cells in each of three independent replicates (two remaining replicates are plotted in Supplementary Fig. 7c). Mean values are shown as red bars with individual data points overlaid. Statistical significance compared to GFP control was measured using a two-tailed Mann-Whitney test. GFP – WT, p=2.53E-8; GFP – C345A, p=0.386; GFP – I267R, p=0.0253; GFP – K268E, p=2E-15. d) Measurement of cis-Golgi-stained puncta size from b) for ~65 cells in each of three independent replicates (two remaining replicates are plotted in Supplementary Fig. 7d). Mean values are shown as red bars, median values are shown as black bars inside a quartile box plot, with individual data points overlaid. Statistical significance compared to GFP control was measured using a two-tailed Mann-Whitney test. GFP – WT, p=6.26E-12; GFP – C345A, p=0.0489; GFP – I267R, p=0.357; GFP – K268E, p=4.32E-10.

