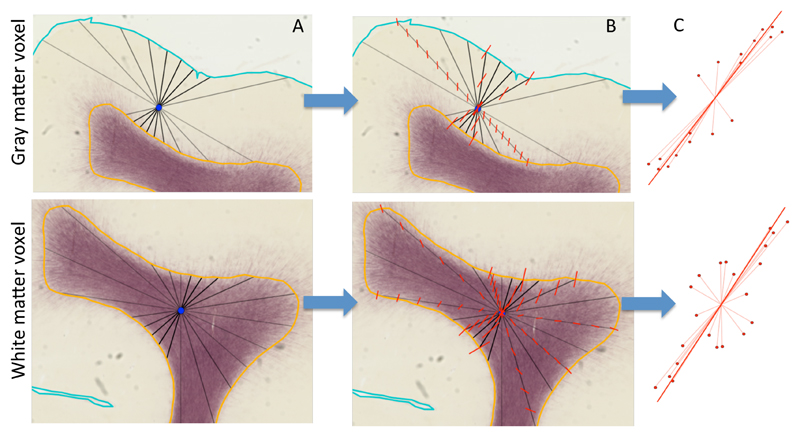
Figure 2.
Illustration of the method for interpolating the radial axis for any point in the cortical grey matter (top panels) and white matter (bottom panels). For illustrative purposes we show the method on 2D myelin-stained histological sections rather than in the 3D MRI data in the rest of this work. The background is a myelin-stained coronal section from a young (postnatal day 6) macaque with the semi-automatically traced white/grey matter boundary (orange) and pial surface (cyan) marked (see Appendix A for details on the macaque data acquisition). A) Through the centre of any point of interest (blue) 300 lines are generated from a uniform orientation distribution (a subset of these lines is shown in black) connecting the white/grey matter boundary with the pial surface (for grey matter; top row) or the white/grey matter boundary with itself (for white matter; bottom row). B) Along each of these lines, the surface normals at both ends are linearly interpolated to the point of interest (illustrated by the red lines). C) The interpolated normals are given a weight inversely proportional to the length of the (black) line along which they are interpolated (eq. 1). Here this weight is illustrated as the length of the interpolated normal. These interpolated normals are averaged using a PCA-type analysis to get the average radial axis (solid red line). A similar method is used to define the sulcal axis running from the deep white matter to the gyral crown, where rather than the surface normal, the sulcal depth gradient along the surface is interpolated.

