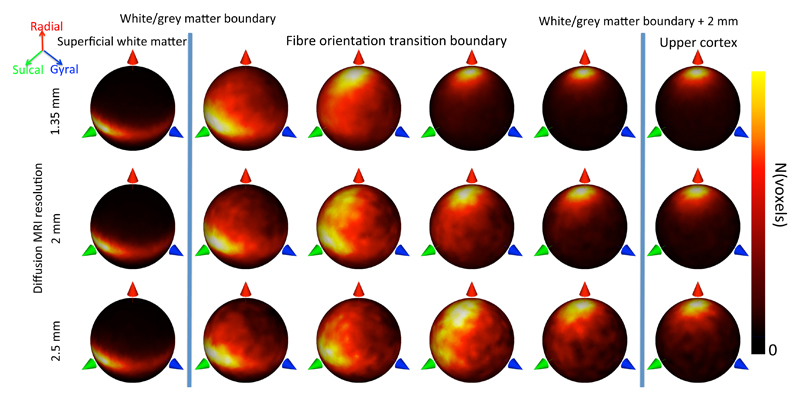
Figure 7.
Transition from tangential fibres in superficial WM (left) to radial fibres in the cortex (right) for diffusion MRI data acquired on the same subject at 1.35, 2, and 2.5 mm resolution. Each heatmap in the fibre orientation transition boundary represents a cortical depth level sampled at steps of 0.5 mm.

