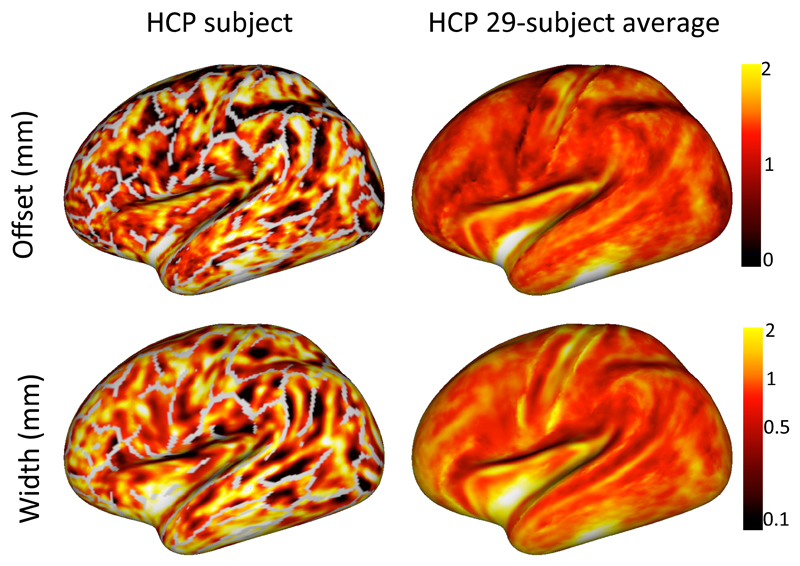
Figure 8.
Maps of the transition offset from the WM/GM boundary (top) and the width of the transition boundary (bottom) for a single HCP subject (left) and a 29-subject average (right). The grey lines on the single-subject surface indicate the gyral crowns, where there is no sharp transition in fibre orientations. Note that in some regions (e.g., the insula) there are insufficient voxels with a radial orientation for an accurate fit, which leads to very high transition offset and width in these regions.

