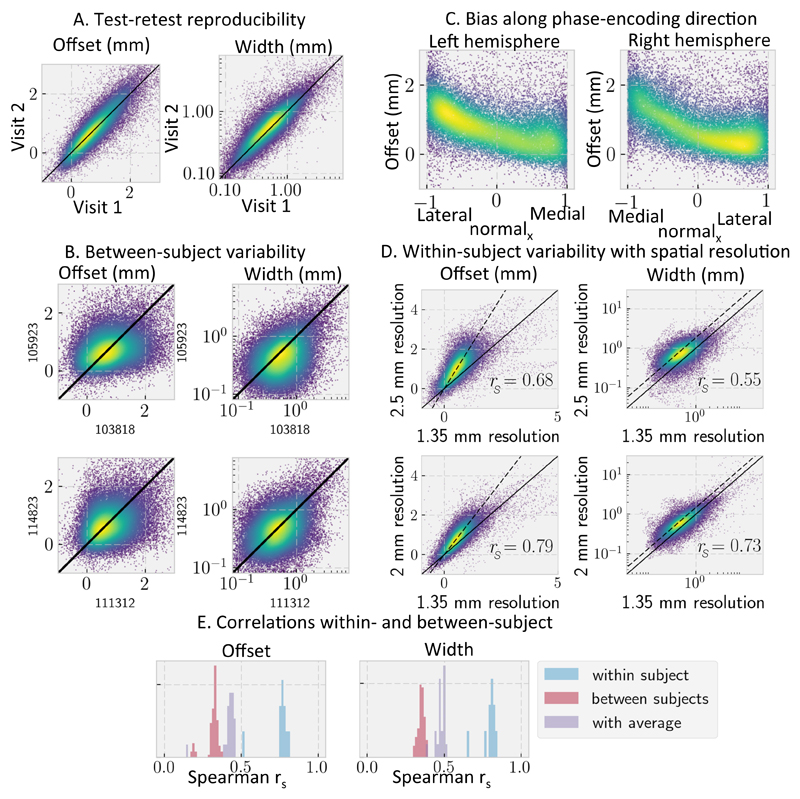
Figure 9.
Correlation in the fibre orientation transition boundary offset from the white/grey matter boundary and the transition width for various acquisition parameters within the same subject and for the same acquisition between subjects. A) Within-subject variability in an HCP subject using the retest dataset; B) Variability between two sets of HCP subjects; C) Correlation between the x-component of the surface normal and the offset between the transition and white/grey matter boundary for an HCP subject; D) Within-subject variability for DTI orientations measured at three different spatial resolutions (1.35, 2, and 2.5 mm resolution). The black lines show the expected trend if the transition offset and width are the same expressed in mm (solid) or voxels (dashed); E) Distribution of Spearman’s rank correlation within individual HCP subjects (blue), between subjects (red), and between individual subjects and a 29-subject average (purple).

