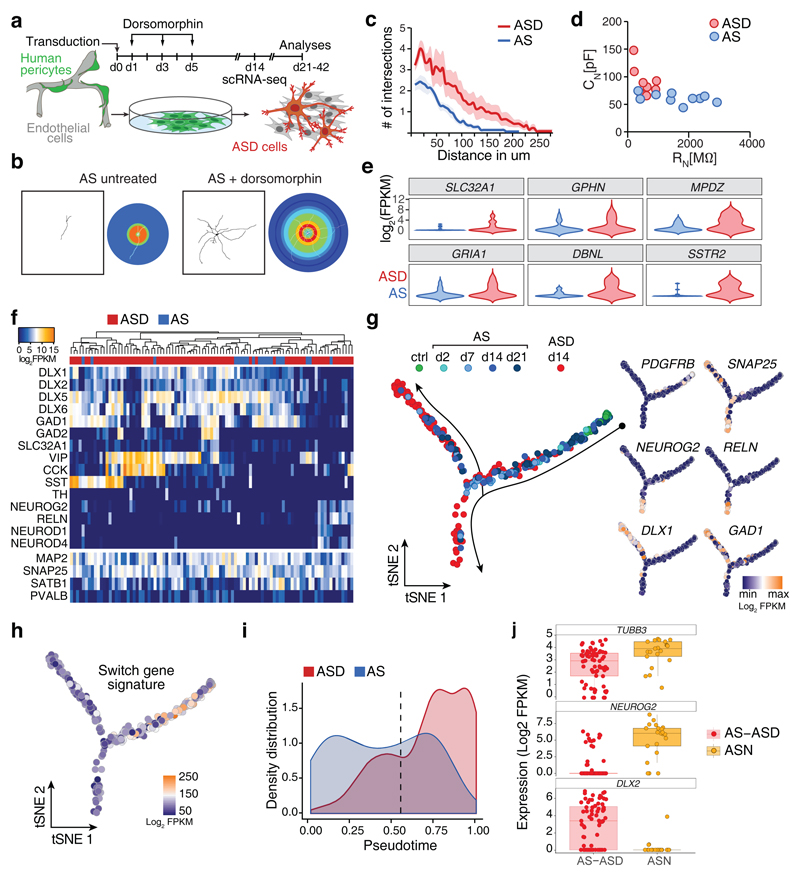
Fig. 5. Pericytes give rise to distinct neuronal subtypes and targeting BMP signaling promotes maturation.
a, Schematical overview of experiments in this figure. b, Representative examples of untreated and Dorsomorphin-treated AS-transduced pericytes showing complex branching of dendritic arbors in Dorsomorphin-treated cells. Neuronal morphology was reconstructed using TUBB3 immunoreactivity and used for Sholl analyses. In the Sholl mask (right panels) warmer hues indicate higher number of intersections (untreated, n = 14 cells of 3 independent experiments; Dorsomorphin-treated, n = 14 cells of 3 independent experiments). c, Single cell neuromorphology reconstruction by Sholl analysis on Dorsomorphin treated AS-transduced cells was compared to untreated cells. Note the increase in complexity of Dorsomorphin-treated cells with higher number of intersections with concentric shells and overall increase in the length of the dendrites (see also Supplementary Fig. 4a). Data are represented in a line graph as mean ± SEM (shaded region) (untreated, n = 14 cells of 3 independent experiments; Dorsomorphin-treated, n = 14 cells of 3 independent experiments). d, Electrophysiological assessment of AS and ASD cells. Membrane capacitance (CN) is plotted as a function of the membrane resistance (RN). AS cells have larger membrane resistances but smaller membrane capacitances when compared to ASD cells. e, Violin blots show the density distribution of expression of selected neuronal maturation genes in neuronal (SNAP25+, MAP2+, PDGFRB-) AS (20 cells) and ASD cells (75). f, PCA followed by hierarchical clustering was used to characterize neuronal cells (SNAP25+, MAP2+, PDGFRB-) AS (20 cells) and ASD cells (75) at 14 dpi regarding the expression of neuronal genes. Note the different interneuron clusters marked by the expression of interneuron subtype-specific genes VIP, SST, and CCK. g, Monocle2 was used to compare maturation of AS and ASD cells. h, Switch gene signature from Fig. 3c was projected onto pseudotemporal ordered trancriptomes of Fig. 5g. i, The density distributions (i.e. normalized cell number per time point of pseudotime) along the pseudotime of AS transcriptomes (d14) from the productive path and ASD transcriptomes (Fig. 5g) are plotted as function of the distance from the start point. Note the shift of ASD cell transcriptomes compared to AS transcriptomes. The dotted line indicates the bifurcation point in Fig. 5g. j, Jitter-boxplot (boxplots show median, quartiles (box), and range (whiskers)) showing the expression of TUBB3 in all SNAP25+, MAP2+, PDGFRB- AS/ASD (71 cells), and ASN (21 cells) cells used for this analysis. Boxplots show the strong increase of NEUROG2 and decrease in DLX2 gene expression in ASN cells as compared to AS and ASD cells.

