
Figure 1.
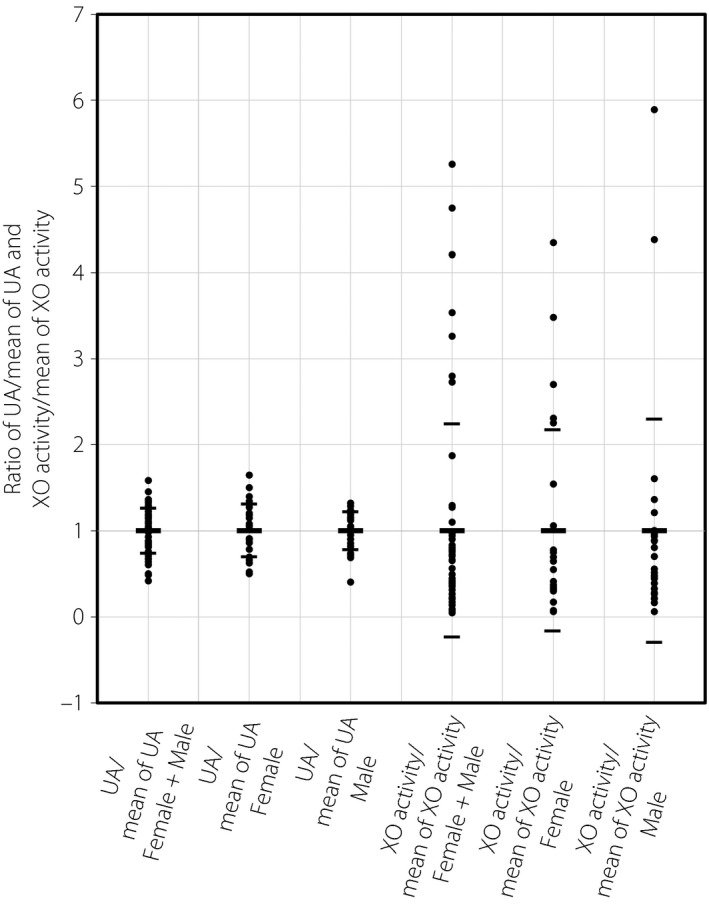
Distribution of the values of plasma xanthine oxidase (XO) activity and serum uric acid (UA) in patients with type 2 diabetes mellitus and metabolic syndrome. “UA/mean of UA” indicates the ratio of serum UA value vs the mean of serum UA value. “XO activity/mean of XO activity” indicates the ratio of plasma XO activity value vs the mean of plasma XO activity value. Small bars in each column show the respective range of standard deviations.