Figure 2.

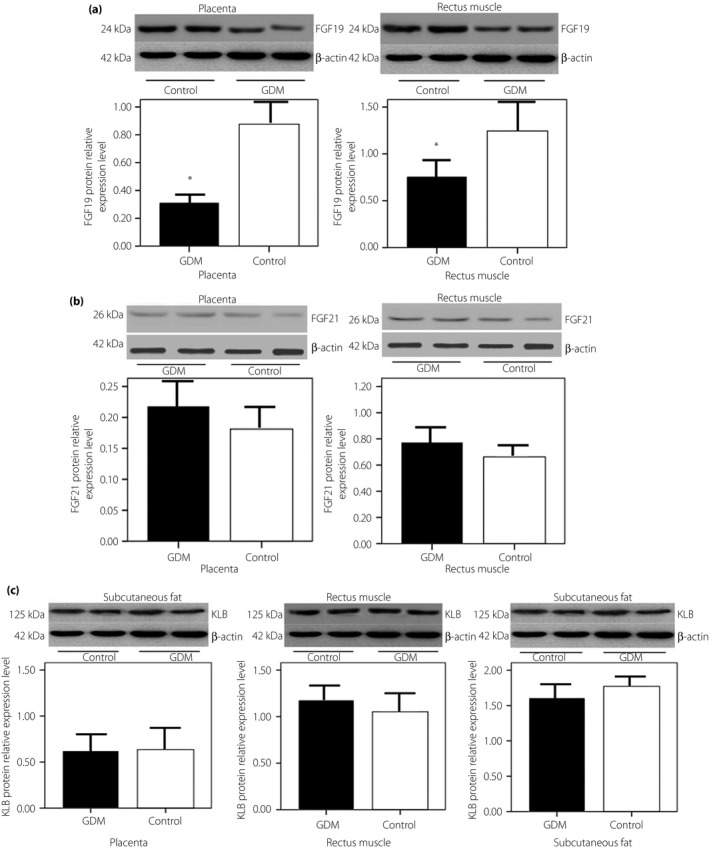
(a) Fibroblast growth factor (FGF)19 and (b) FGF21 protein relative expressions in gestational diabetes mellitus (GDM) and control placenta and rectus muscle tissues, and (c) β‐klotho (KLB) protein relative expression in GDM and control placenta, rectus muscle and subcutaneous fat tissues by western blot. Representative western blot shows FGF19 (24 kDa), FGF21 (26 kDa) and KLB (125 kDa) protein expression, and the loading control β‐Actin (42 kDa). Densitometry analysis of FGF19 expression normalized to β‐Actin in the placenta and rectus muscle tissues from GDM (n = 20) and control (n = 25) pregnancies. *Significant difference P < 0.01. Each bar represents median levels. Black bars, GDM pregnancies; white bars, control pregnancies.
