
Fig. 3.
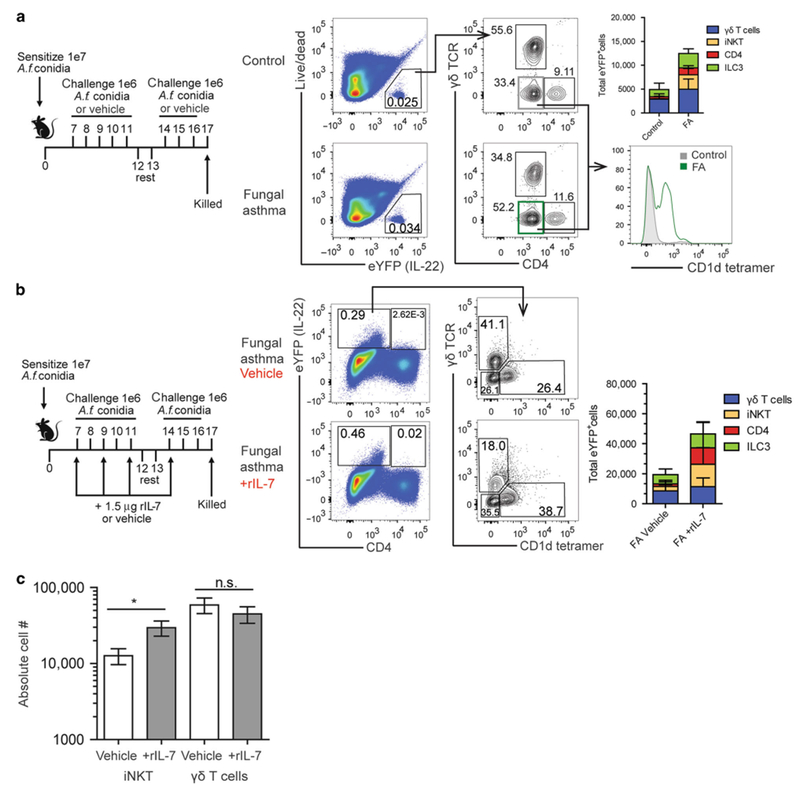
IL-22 cell sources during experimental fungal asthma. a IL-22CreR26ReYFP reporter mice were subjected to experimental fungal asthma or a control exposure (PBS). At 24 h after the last organism challenge, the right lungs were collected, enzymatically digested and unfractionated lung cells cultured for 4 h in the presence of IL-1β. Lung cells were Fc-blocked, stained with a live/dead staining kit followed by staining with fluorochrome-conjugated antibodies corresponding to γδ T cells, iNKT cells, CD4 T cells and ILC3s. The Figure illustrates concatenated flow plots from a representative experiment. Results show the absolute cell numbers of eYFP+IL-22+γδ T cells, iNKT cells, CD4 T cells and ILC3s. b IL-22CreR26ReYFP reporter mice were subjected to experimental fungal asthma and administered IL-7 or vehicle. At 24 h after the last organism challenge, the right lungs were collected, enzymatically digested and unfractionated lung cells cultured for 4 h in the presence IL-1β. Lung cells were Fc-blocked, stained with a live/dead staining kit followed by staining with fluorochrome-conjugated antibodies corresponding to γδ T cells, iNKT cells, CD4 T cells and ILC3s. Results show the absolute numbers of eYFP+IL-22+γδ T cells, iNKT cells, CD4 T cells and ILC3s. The Figure illustrates concatenated flow plots from a representative experimental. c C57BL/6 mice were subjected to experimental fungal asthma and administered IL-7 as in (b). At 24 h after the last organism challenge, the right lungs were collected, enzymatically digested and unfractionated lung cells enumerated, Fc-blocked, stained with a live/dead staining kit and stained with fluorochrome-conjugated antibodies corresponding antibodies corresponding to iNKT cells and γδ T cells. The Figure illustrates cumulative data from two to three independent studies. Data are expressed as total number of iNKT cells and γδ T cells. *P value of <0.05; n = 4–6 mice/group for each study; each data point/dot represents a single mouse and the line in each group corresponds to the mean