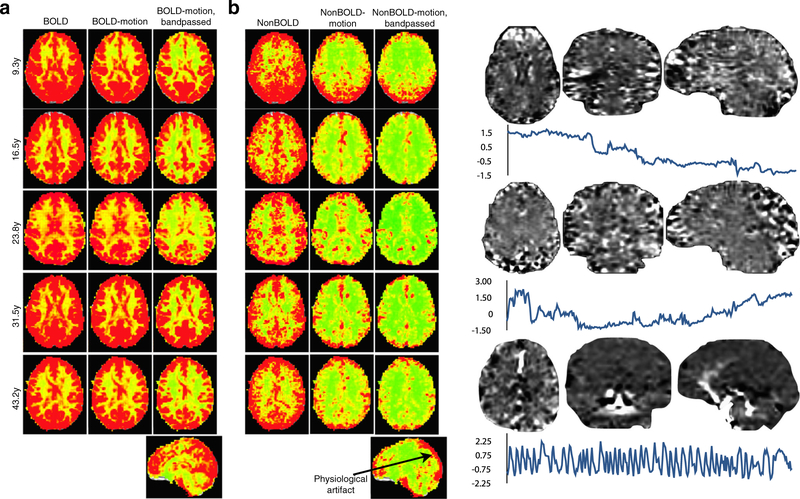
Fig. 5.
Standard deviation maps for subjects of varying age for assessing the cumulative effect of ME-ICA denoising. (a) assess the BOLD signal space. (b) assesses the separate non-BOLD/artifact space. The leftmost columns for each signal space show voxel-wise standard deviation maps. The middle columns show standard deviation maps after motion regression. BOLD signal shows no substantial change after motion regression, indicating that motion artifact is not a significant effect in this signal space. In contrast, the non-BOLD space shows a significant reduction in standard deviation after regressing out motion artifacts, indicating the non-BOLD space to contain these artifacts. The rightmost column shows standard deviation after motion regression and 0.01Hz-0.1Hz bandpass filtering. Standard deviation is attenuated somewhat in the BOLD space, but the overall structure remains consistent. In the non-BOLD space, even after filtering, non-BOLD variance remains due to artifactual physiological signals from the draining veins. (c) shows example components that are not obviously related to subject motion, but also not clearly related to functional networks. These are clearly demarcated as non- BOLD by ME-ICA and removed from data in denoising

