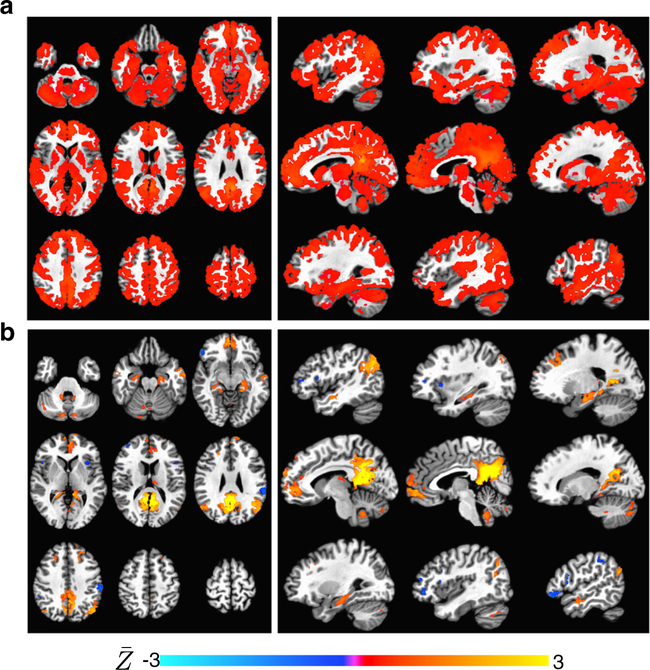
Fig. 7.
Group-level seed-based connectivity analysis of the default mode network (PCC seed) using conventional time series correlation (ME denoised) and ME-ICR. Overlays are mean Z across subjects. Maps are thresholded by T-values. a Axial and sagittal views of onesample T-test maps of subject Z-maps based on time series correlation across 25 subject datasets of ages 9–43. Maps are thresholded p¡0.001 (uncorrected). This analysis (which does not implement global signal regression) produces spuriously high significance, resulting in minimal specificity in DMN map despite a high threshold. b Corresponding views of the one-sample T-test of Z-maps based on MEICR on datasets representing the same cohort. Maps are thresholded as in b. ME-ICR does not utilize global signal regression, but specifically isolates the default mode network and delineates subcortical nodes including hippocampus and nucleus accumbens

