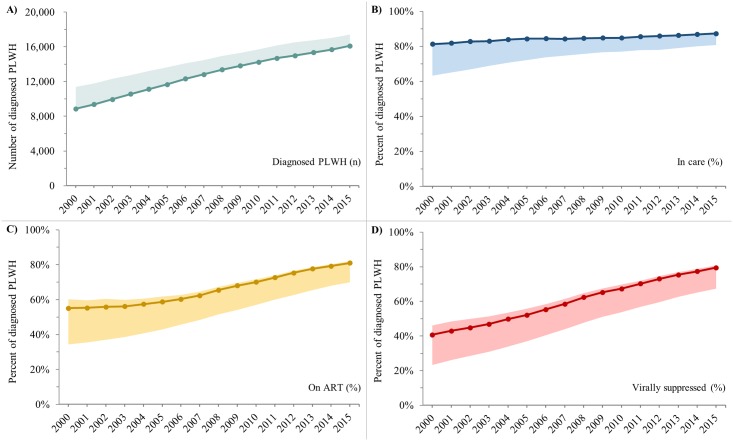
Fig 2. Trends in the number of diagnosed PLWH and the percent who were in care, on ART, and virally suppressed, Ontario HIV Laboratory Cohort, 2000–2015.
A) Number of diagnosed PLWH. B) Percent of diagnosed PLWH who were in care. C) Percent of diagnosed PLWH who were on ART. D) Percent of diagnosed PLWH who were virally suppressed. Solid lines represent “main” estimates and shaded areas represent “upper” and/or “lower” bounds. See Table 1 for indicator definitions. PLWH = people living with HIV. ART = antiretroviral treatment.

