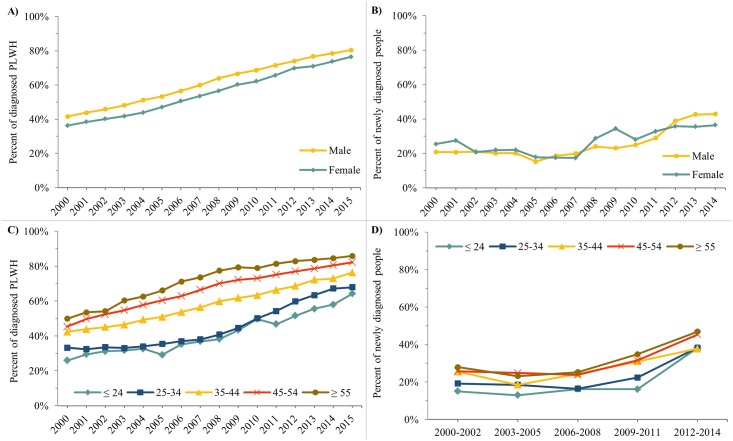
Fig 5. Trends in viral suppression indicators by sex and age category (main estimates only), Ontario HIV Laboratory Cohort, 2000-2014/15.
A) Percent of diagnosed PLWH who were virally suppressed by sex. B) Percent of newly diagnosed individuals who achieved viral suppression within 6 months of HIV diagnosis by sex. C) Percent of diagnosed PLWH who were virally suppressed by age category. D) Percent of newly diagnosed individuals who achieved viral suppression within 6 months of HIV diagnosis by age category. In Fig D, percents averaged over three years to reduce year-to-year variation due to small counts. In Fig 5B and 5D, individuals with no VL are included in the denominator.

