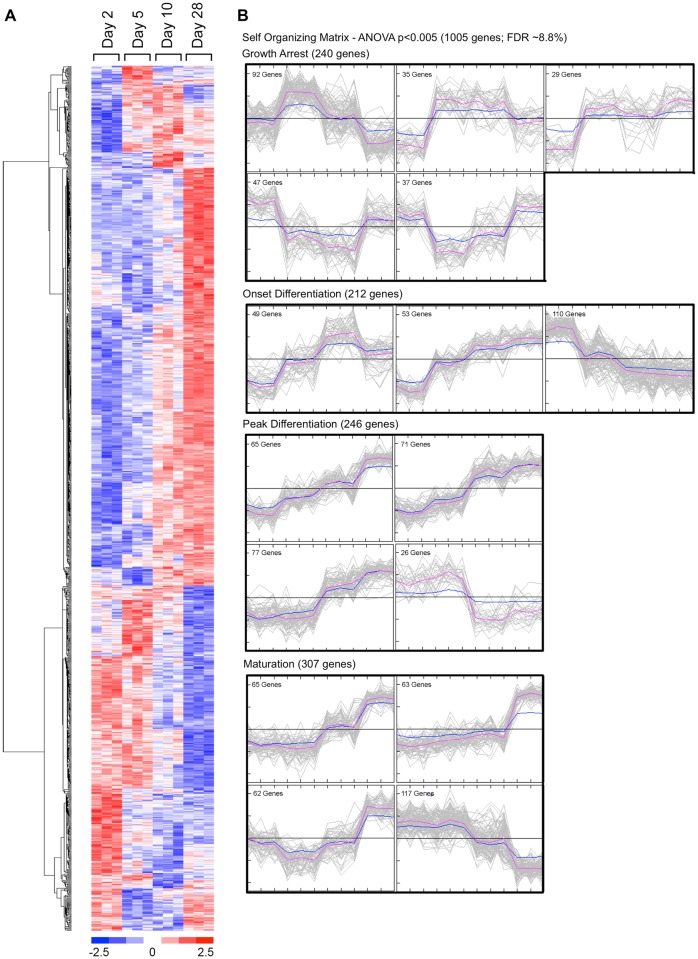
Fig 3. Temporal patterns of change in the MC3T3-E1 transcriptome during differentiation.
Total RNA was isolated from three independent MC3T3-E1 cell cultures following 2, 5, 10 or 28 days in culture. Each biological replicate was hybridized to an Operon version 2.0 spotted oligonucleotide array (12 microarrays). Triplicate microarray data at each time point were used to identify significantly regulated mRNAs at different phases of osteoblast differentiation by ANOVA (p<0.005; estimated false discovery rate 8.8%). A. Heat map representing observed mRNA abundance of 1005 genes identified by ANOVA as demonstrating a significant difference between any two time points. Hierarchical clustering was used to identify coordinated patterns of change. B. Sixteen cluster SOM representing temporal changes in mRNA abundance associated with MC3T3-E1 differentiation. Expression data were subjected to z-standardization and SOM assembled using MeV software. The resulting 16 SOM clusters are shown grouped in relation to the differentiation state of MC3T3-E1 cells. Growth arrest was associated with abrupt changes (increase or decrease) in mRNA levels between days 2 and 5 (240 genes). The onset of differentiation was associated with progressive changes in mRNA levels between days 2 and 10 (212 genes). Peak differentiation was associated with prominent changes in mRNA levels between days 5 and 10 (246 genes). Osteoblast maturation was associated with prominent changes in mRNA levels between days 10 and 28 (307 genes).

