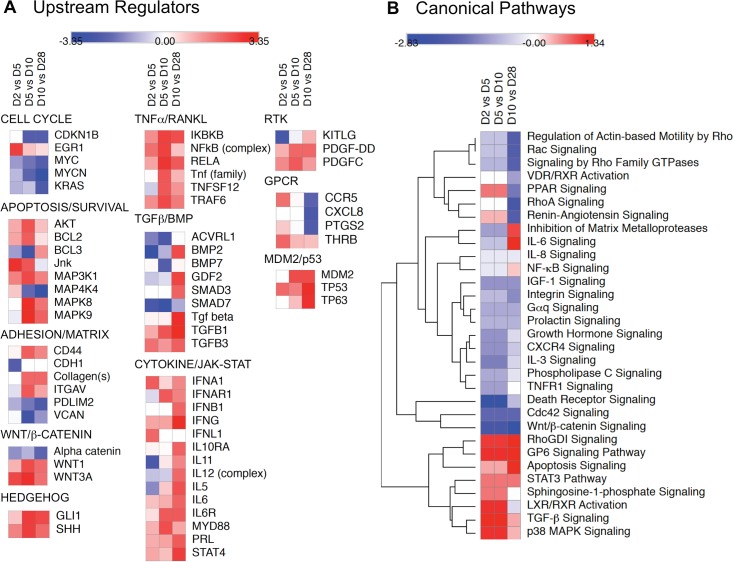
Fig 5. Temporal changes in predicted upstream regulators and canonical signaling pathways associated with MC3T3-E1 cell differentiation.
Microarray data on the 976 significantly regulated mRNA species were used to calculate change in expression ratio between D2 vs D5, D5 vs D10, and D10 vs D28. Expression ratios were analyzed using IPA Upstream Regulator and Canonical Pathways Analysis software and heat maps reflecting the changes in predicted activity during each interval were generated using Morpheus software. A. Heat maps depicting changes in selected upstream regulators (rows) with activation z-scores >2 (red) or <-2 (blue) during at least one phase of differentiation (columns). Upstream regulators were arbitrarily grouped based on their involvement is biological processes or signaling pathways related to osteoblast differentiation. B. Heat maps depicting changes in z-score for selected canonical signaling pathways (rows) during each phase of differentiation (columns). Z-scores were subjected to Euclidean hierarchical clustering in Morpheus to group pathways based on similarity in temporal change.

