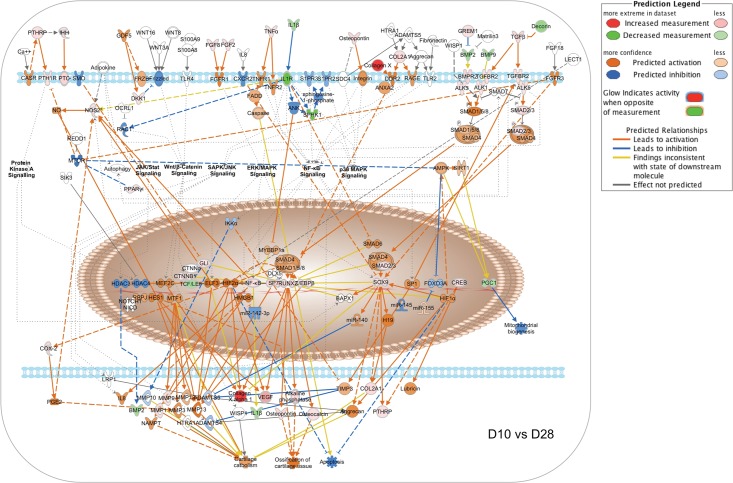
Fig 10. Changes in canonical signaling pathway activity in MC3T3-E1 cells between days 10 and 28.
Expression ratios representing the changing abundance of 237 bone-related mRNA species in MC3T3-E1 cells between days 10 and 28 in culture were used to populate the IPA osteoarthritis pathway network and signaling pathway activation state was assessed using the IPA molecular pathway predictor tool. Observed upregulation and downregulation of mRNAs are shown in red and green, respectively, while predicted activation or inhibition of signaling intermediates and pathways are shown in orange and blue.

